
Figures & data
Table 1 Incident cases of head and neck cancers in Estonia, 1996–2016
Figure 1 Stage distribution (%) of head and neck cancers in Estonia, 2010–2016.
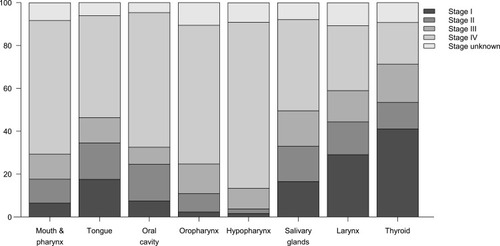
Figure 2 Observed (dashed line) and modeled (solid line) age-standardized (world) incidence rates and annual percentage change (APC) with 95% confidence intervals for trends in head and neck cancer incidence in Estonia, 1996−2016. *APC is significantly different from zero at α=0.05.
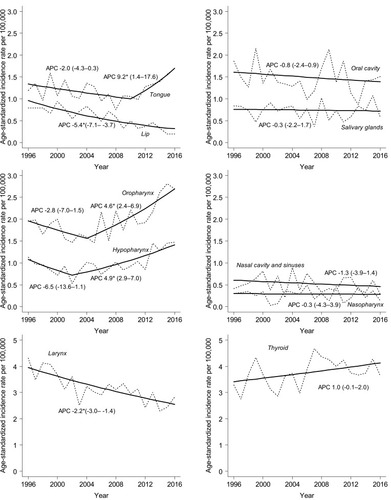
Table 2 Age-standardized five-year relative survival ratio (RSR) of head and neck cancers by site and histology in Estonia, 1996–2016
Table 3 Age-Standardized five-year relative survival ratio (RSR) of head and neck cancers by sex and histology in Estonia, 2010–2016