Figures & data
Table 1 Number and Percentage of Hysterectomies, Stratified by Age, Calendar Year, and Surgical Procedure
Table 2 Overall Hysterectomy-Corrected, Age-Standardized (US 2010 Female Population) Incidence Rate per 100,000 Person-Years, Stratified by Age, Indication, and Surgical Procedure
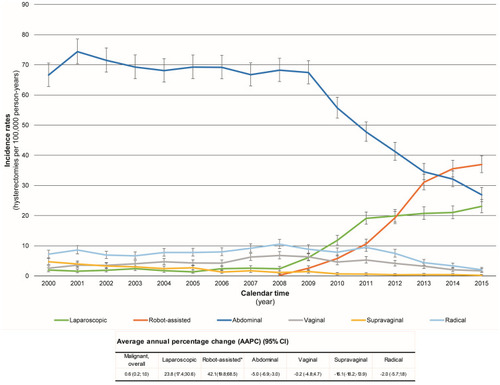
Figure 1 Age-standardized (US 2010 female population) hysterectomy-corrected incidence rates of hysterectomy over calendar time and corresponding average annual percentage change stratified by surgical procedure.
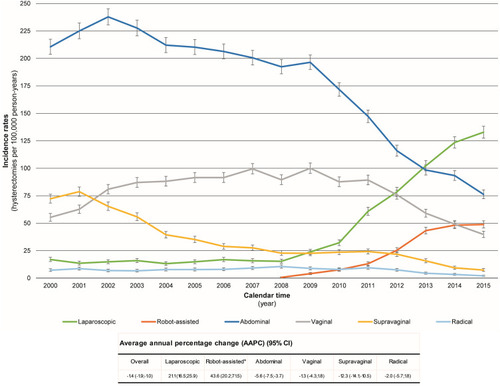
Figure 2 Age-standardized (US 2010 female population) hysterectomy-corrected incidence rates of hysterectomy over calendar time and corresponding average annual percentage change among women with benign disease, stratified by surgical procedure.
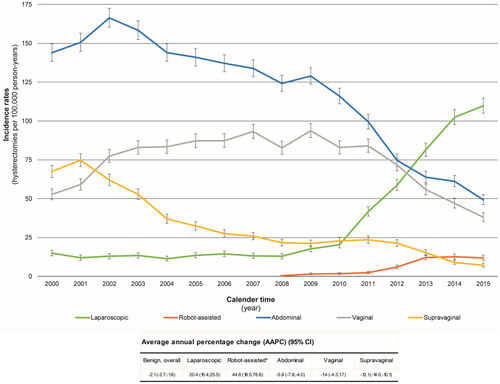
Figure 3 Age-standardized (US 2010 female population) hysterectomy-corrected incidence rates of hysterectomy over calendar time and corresponding average annual percentage change among women with malignant disease, stratified by surgical procedure.