Figures & data
Figure 1 Graphical illustration of the income-related inequality in quality of care using absolute concentration index (2004–14).
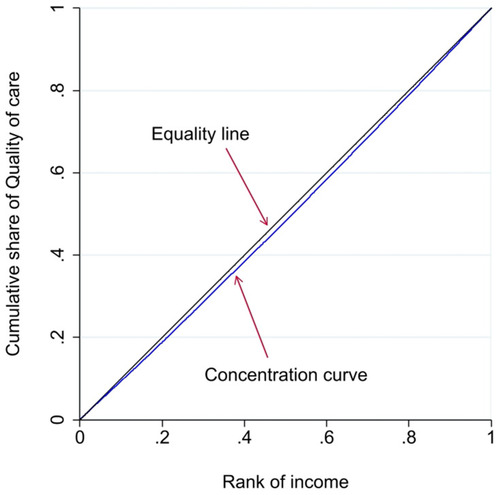
Figure 2 Graphical illustration of the income-related inequality in quality of care using slope index of inequality (2004–14).
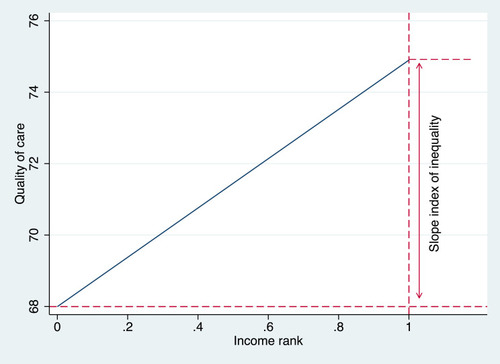
Table 1 Study Population
Table 2 Univariate Indices of Inequality in Quality of Care
Table 3 Bivariate Indices of Inequality in Quality of Care
Table 4 SII Under Different Definitions of Income
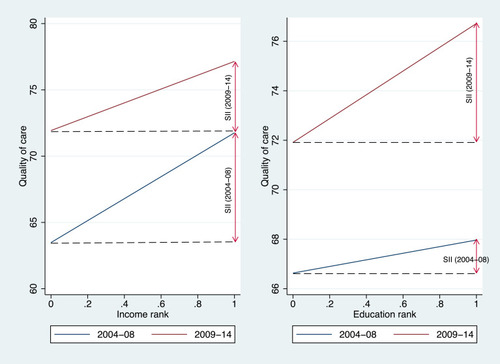
Figure 3 Slope inequality indices over time.