Figures & data
Table 1 Incident Cases, Deaths and DALYs for Selected Respiratory Infections and Tuberculosis and Percentage Change of Age-Standardized Rates by Sex in United States, 1990–2019
Figure 1 Age-standardized incidence (A) and death rate (B) of RIT by cause and age group, 2019.
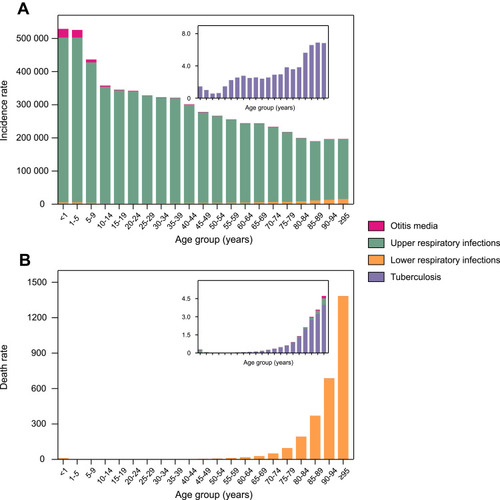
Figure 2 RIT burden for each state in the US. (A) Age-standardized incidence rate of RIT in 2019. (B) Age-standardized death rate of RIT in 2019. (C) Change in age-standardized incidence rates of RIT, 1990–2019. (D) Change in age-standardized death rates of RIT, 1990–2019.
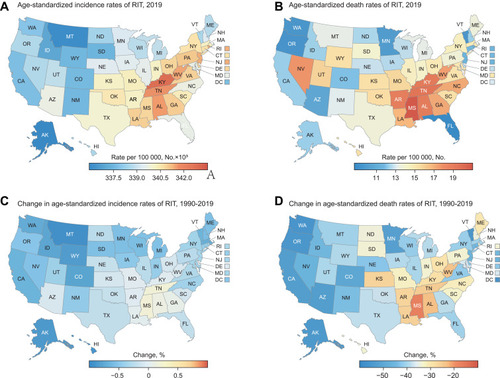
Figure 3 Age-standardized death rate of RIT across US states in 2019 (A) and its percentage change from 1990 to 2019 (B) by socio-demographic index.
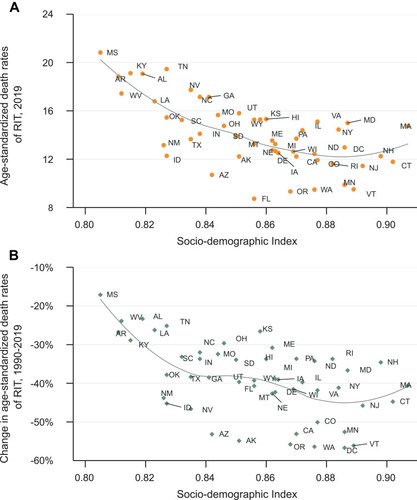
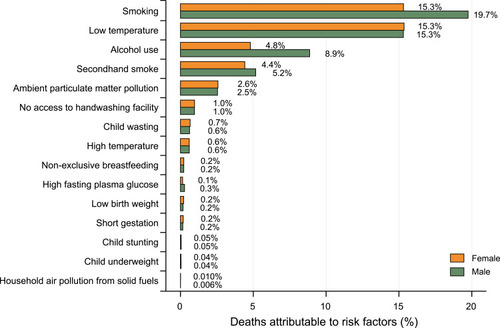
Figure 4 Percentage contributions of major risk factors to RIT age-standardized deaths by gender, 2019.