Figures & data
Table 1 Characteristics and Main Outcomes of Included Studies
Figure 1 PRISMA diagram of the review. The diagram describes the procedures conducted for meta-analyses, including literature searches, review processes, records excluded in each process, and the final studies included for data extraction and analyses.

Figure 2 Risk of bias assessment for included studies. The evaluation of all included studies on their reporting biases according to the Cochrane risk of bias tool.
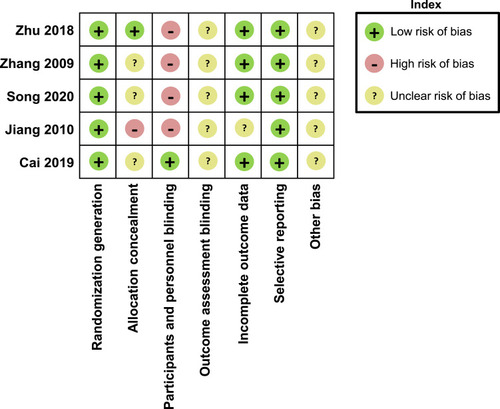
Figure 3 Remission rates of constipation symptoms in OIC patients. RRs were calculated to estimate the therapy outcomes of acupuncture in comparison with Control groups. (A) Overall remission rate including cured cases, obvious remissions, and effective remissions; (B) cured rate; (C) rate of obvious remissions; (D) rate of effective remissions.
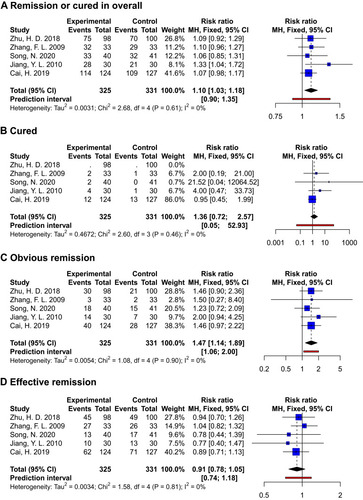
Figure 4 The funnel plot of cured or remission rate data. Grey rectangles represent included studies.
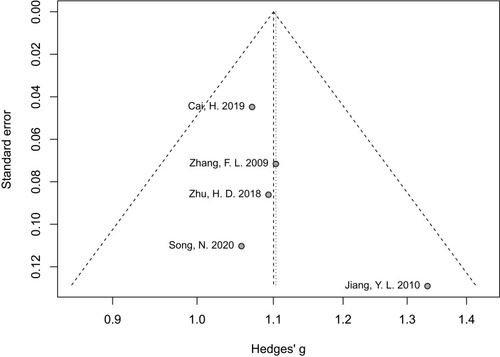
Figure 5 Meta-analyses of symptom scores and subgroup analyses for studies with or without co-intervention. (A) The overall symptom scores calculated with standardized mean difference referring to the control group. (B) The subgroup analyses of symptom scores defining by acupuncture with or without other co-intervention strategies.
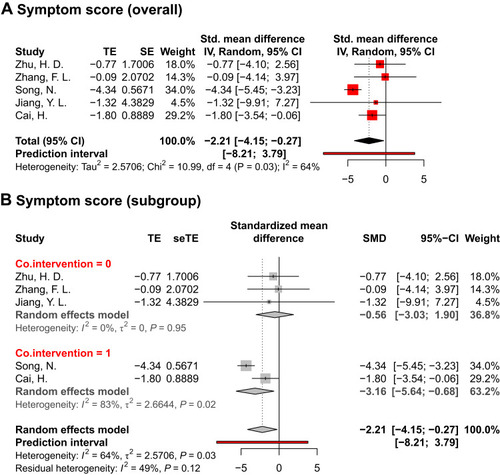
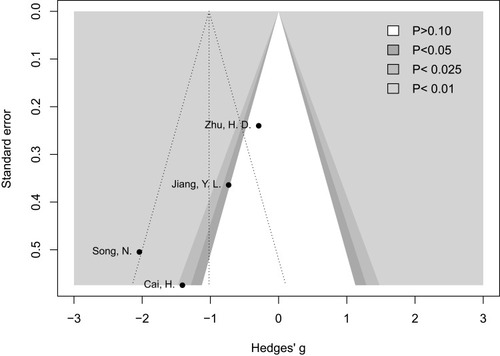
Figure 6 Contour-enhanced funnel plot of acupuncture versus control for symptom scores. Black dots represent included studies. Gradient grey colors indicate different significant levels.
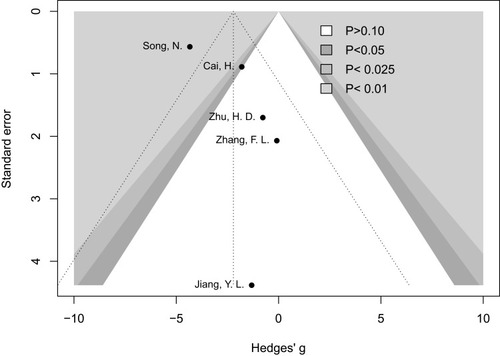
Figure 7 Meta-analyses of quality of life scores and subgroup analyses for studies with or without co-intervention strategies. (A) The overall quality of life scores calculated with standardized mean difference comparing to the control group. (B) The subgroup analyses of the quality of life scores defining by acupuncture with or without co-interventions. No quality of life score was reported in Zhang, F.L.’s paper; therefore, a 0.00% weight was allocated in the analyses.
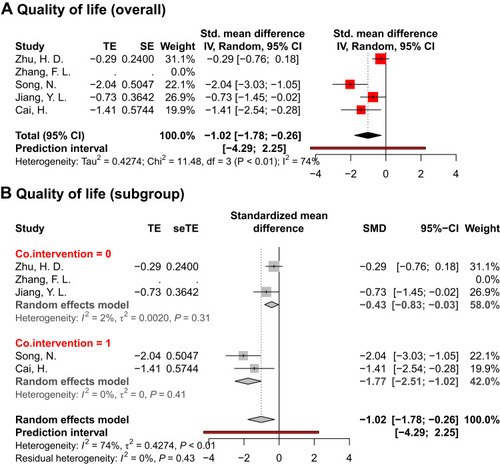
Figure 8 Contour-enhanced funnel plot of acupuncture versus control for quality of life scores. Black dots represent included studies. Gradient grey colors indicate different significant levels.