
Figures & data
Figure 1 Grouping of drug entries into drug cycles.
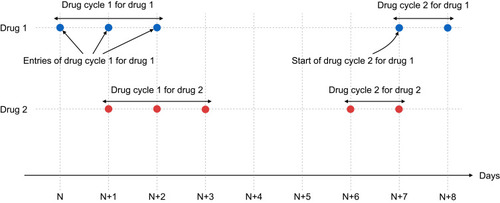
Table 1 Study Population Characteristics
Table 2 PPV, Sensitivity, and F1-Score for Patients and L01 Drug Cycles per Diagnosis
Figure 2 Positive predictive value vs sensitivity for the matching of drug cycles per cancer diagnosis. The area of the circle is proportional to the number of corresponding drug cycles. The lighter circles in the background correspond to the performances with a 1-day margin.
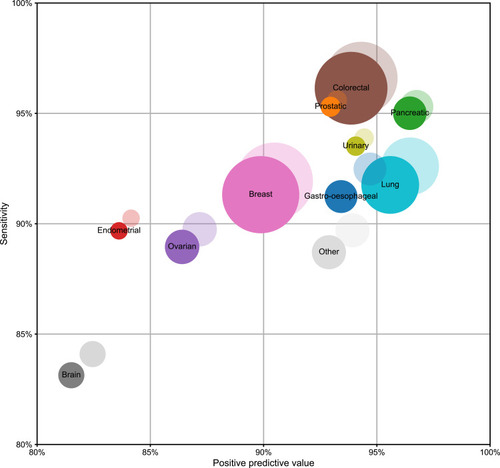
Figure 3 Evolution over time of the validity of the DNPR registrations for L01 drug cycles for systemic anticancer treatments. The lighter surface above each line represents the gain in performance by adding a 1-day margin.
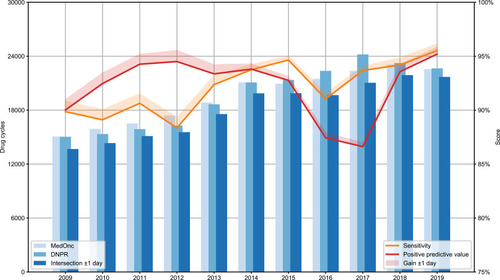
Figure 4 Evolution over time of the validity of the DNPR registrations for bottom 9 performing L01 drugs. Only drugs with more than 500 cycles were considered. The lighter surface above each line represents the gain in performance by adding a 1-day margin.
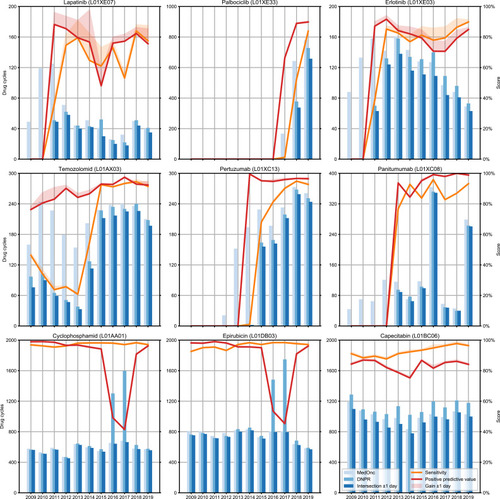
Table 3 Matching Performances for Drug Cycles per Drug Type for Drugs with More Than 500 Cycles in MedOnc