
Figures & data
Figure 1 Flowchart of the case selection process in the study.
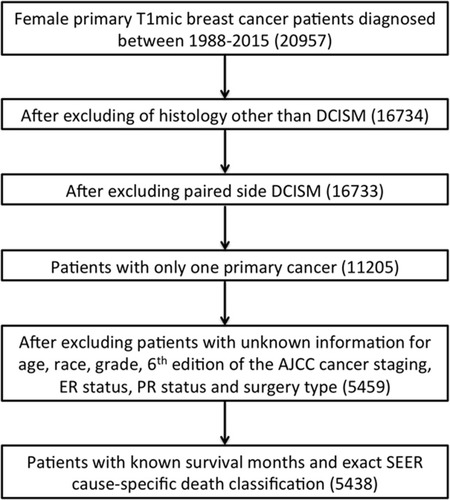
Table 1 The Individual Characteristics of Variables Involved in the Study
Figure 2 Nomogram to calculate risk score and predict 5-year, 10-year, and 15-year BCSS probability. By summing the points identified on the top scale for each independent variable and drawing a vertical line from the total points scale to the 5-year, 10-year, and 15-year BCSS, the corresponding survival probability can be obtained. Age, 1 = under 40 years, 2 = 41–50 years, 3 = 51–70 years, 4 = over 70 years; Race, 1 = Caucasian, 2 = African American, 3 = American Indian/Alaska Native or Asian/Pacific Islander; Year of diagnosis, 1 = 1988–2001, 2 = 2002–2015; AJCC 6th N stage, 0 = N0 stage, 1 = N1 stage, 2 = N2 stage, 3 = N3 stage; Surgery, 0 = no surgery, 1 = lumpectomy, 2 = mastectomy; Chemotherapy, 0 = no, 1 = yes; PR status, 0 = negative, 1 = positive.
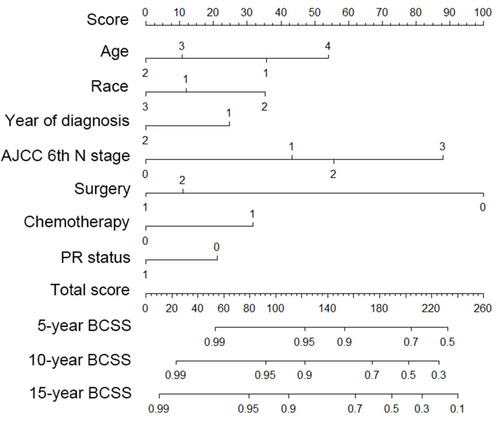
Table 2 Univariate and Multivariate Analyses of Breast Cancer-Specific Mortality
Figure 3 ROC curves and calibration plots for predicting BCSS. ROC curves of the nomogram predicting prognosis in the training set (A) and the validating set (B). Calibration curves comparing predicted and actual BCSS proportions at 5-year (C), 10-year (D), and 15-years (E), separately. Each point in the plot refers to a group of patients, with the nomogram predicted probability of survival shown on x axis and actual survival proportion shown on y axis. Distributions of predicted survival probabilities are plotted at the top. Error bars represent 95% confidence intervals. (F) 5-year, 10-year and 15-year BCSS in patients with each subtype of breast ductal carcinoma in situ with microinvasion.
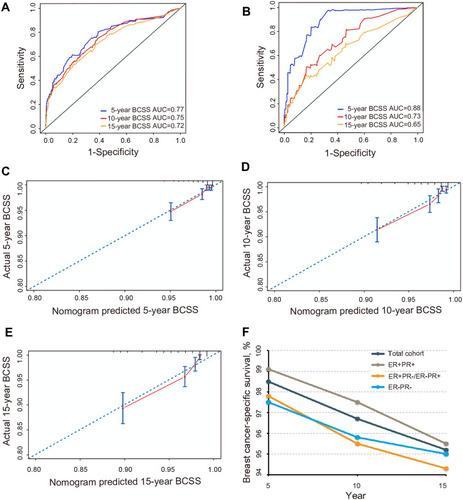
Figure 4 The survival curves for DCISM patients with and without chemotherapy and radiotherapy after 1:1 matching. (A) Kaplan-Meier curve depicting the association between chemotherapy and breast DCISM. Kaplan-Meier curve depicting the association between chemotherapy and breast DCISM in ER+PR+ (B), ER+PR-/ER-PR+ (C) and ER-PR- subgroup (D). (E) Kaplan-Meier curve depicting the association between radiotherapy and breast DCISM.
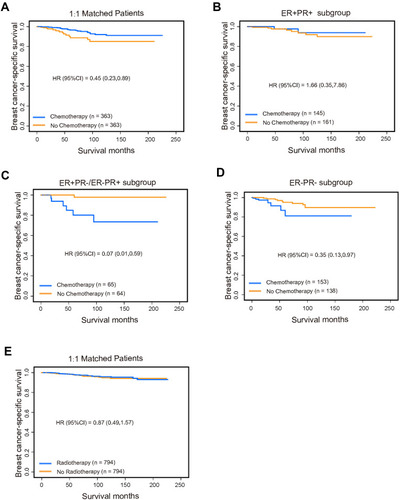
Table 3 BCSS of Patients with DCISM Between Statistically Matched Chemotherapy and Non-Chemotherapy Groups