Figures & data
Table 1 Reported chronic symptoms, spirometry, and COPD
Table 2 Construct validity and reliability of COPD Symptoms Index (scaleTable Footnote*)
Table 3 Logistic regressionTable Footnote* for COPD correlates
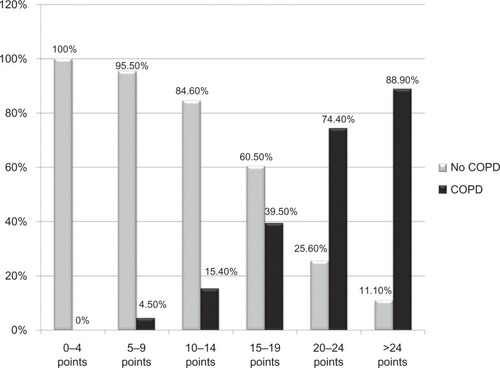
Figure 1 Receiver-operating characteristic curve for threshold selection of Diagnosis Score for Chronic Obstructive Pulmonary Disease score.
Note: Area under the curve = 0.849 (0.826–0.873, P < 0.001).
Abbreviation: ROC, receiver-operating characteristic curve.
Abbreviation: ROC, receiver-operating characteristic curve.
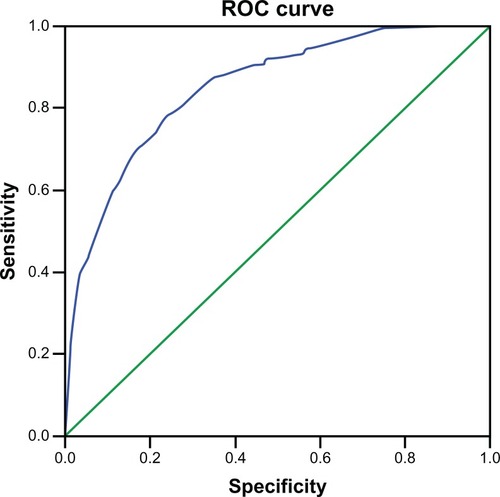
Table 4 Coordinates of the receiver-operating characteristics curve
Figure 2 Percentages of COPD and of respiratory symptoms (not COPD) by category of Diagnosis Score for COPD in symptomatic individuals.
Abbreviation: COPD, chronic obstructive pulmonary disease.