
Figures & data
Figure 1 Flowchart of matching-adjusted indirect comparisons (MAIC), the validation of the MAIC method, and the second-order indirect comparison.
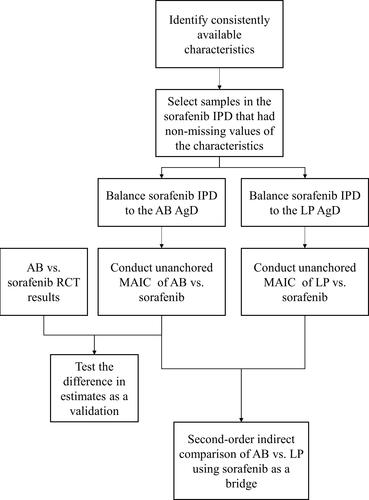
Table 1 Comparison of Characteristics Before and After Entropy Balancing
Figure 2 The kernel density of the entropy balancing weights of individual-level patients (IPD) in the sorafenib arm when balanced to the atezolizumab plus bevacizumab (AB) arm and the lenvatinib plus pembrolizumab (LP) arm. The deviation and dispersion of each line from the black vertical line demonstrate the unbalance of sorafenib IPD and the aggregate data of the corresponding comparator regimen before entropy balancing. The dissimilarity of the two lines of entropy balancing weights represents the unbalance between the aggregate data of the AB and LP arms.
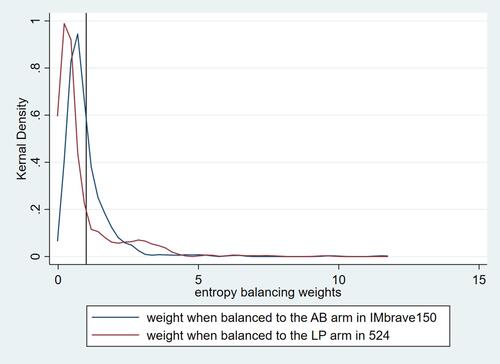
Table 2 The Matching-Adjusted Indirect Comparison Estimates of Hazard Ratios of Overall Survival and Progression-Free Survival
Table 3 Second-Order Indirect Comparisons of Atezolizumab Plus Bevacizumab vs Lenvatinib Plus Pembrolizumab
Table 4 The E-Values of Estimated Hazard Ratios in the Present Study