Figures & data
Figure 1 Flow diagram of cohort derivation.
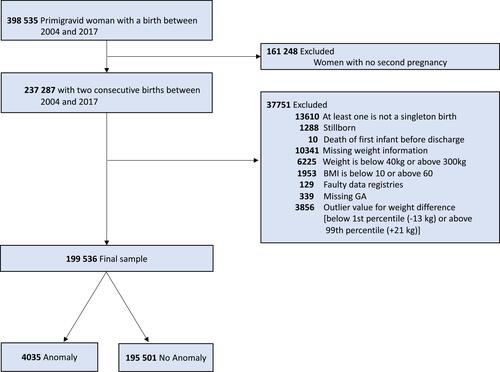
Table 1 Characteristics of the Mothers and Their First- and Second-Born Infants. All Data are Presented as a Number (%) Unless Otherwise Indicated
Figure 2 Interpregnancy weight difference among mothers who ielivered an infants with vs without major congenital anomalies. Analyses stratified based on baseline BMI: underweight (BMI < 18.5 kg/m2), normal weight (BMI 18.5 to <25 kg/m2), overweight (BMI 25 to <30 kg/m2) or obesity (BMI 3 30 kg/m2). Models adjusted for interpregnancy interval, maternal age, immigrant status, income, marital status, smoking status at the first pregnancy, gestational diabetes, chronic hypertension, preeclampsia/eclampsia and depression.
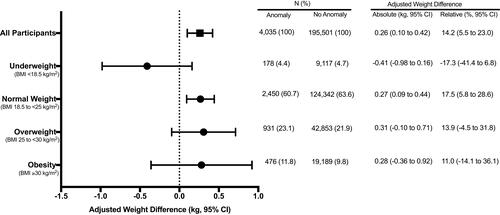
Figure 3 Interpregnancy weight difference among mothers who delivered an infant with multiorgan or single-organ major congenital anomalies vs without major congenital anomalies. Analyses stratified based on baseline BMI: underweight (BMI < 18.5 kg/m2), normal weight (BMI 18.5 to <25 kg/m2), overweight (BMI 25 to < 30 kg/m2) or obesity (BMI 3 30 kg/m2). Models adjusted for interpregnancy interval, maternal age, immigrant status, income, marital status, smoking status at the first pregnancy, gestational diabetes, chronic hypertension, preeclampsia/eclampsia and depression.
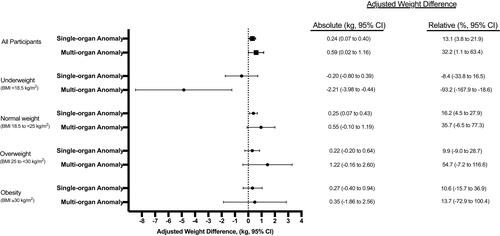
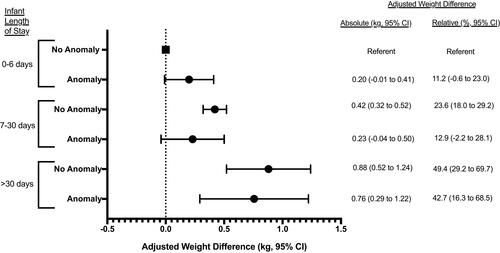
Figure 4 Interpregnancy weight difference among mothers who delivered an infants with and without major congenital anomalies with varying total infant days of hospitalizations in the interpregnancy interval. Models adjusted for interpregnancy interval, maternal age, immigrant status, income, marital status, smoking status at the first pregnancy, gestational diabetes, chronic hypertension, preeclampsia/eclampsia and depression. Referent group = infants born without major congenital anomalies with total hospitalizations of 0–6 days.