Figures & data
Table 1 The Baseline Characteristics of Study Population
Figure 1 (A) The dose-response effect of TB on COPD as a categorical variable in the overall population. Solid black curves are multivariable-adjusted odds ratios, with light blue area showing 95% confidence intervals derived from restricted cubic spline regressions with three splines based on Logistic regression model. The reference line for no association is indicated by dashed red line at a odds ratio of 1.0. The red arrow represents the approximate cut-off value of bilirubin. The model was adjusted for age, sex, BMI and smoke index. (B) Forest plot quantifying associations of TB categorized into five centiles with the risk of COPD. The reference range is defined to cover a limit at a odds ratio of 1 derived from curves in A. The model was adjusted for age, sex, BMI and smoke index.
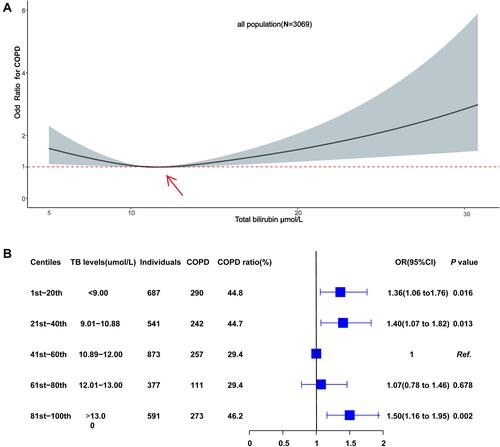
Figure 2 The dose-response effect of TB on FEV1/FVC on a continuous scale in the overall population. Solid black curves show the dose-response effect, with light blue area showing 95% confidence intervals derived from restricted cubic spline regressions with three splines based on Ordinary Least Squares model. The red arrow represents the approximate cut-off value of bilirubin. Analyses were adjusted for age, sex, BMI and smoke index.
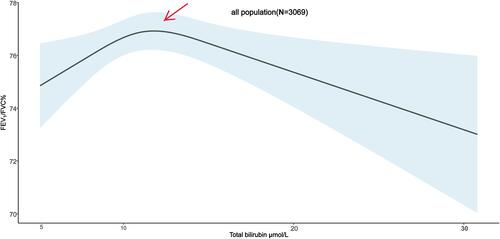
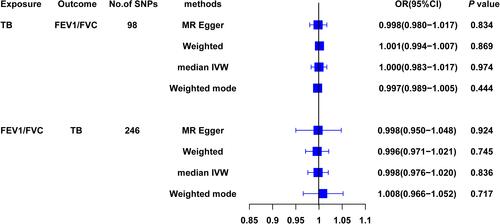
Figure 3 The forest plot for Estimates of causal effects between serum TB and FEV1/FVC. Both estimates coefficients of MR and reverse MR calculated using four methods including MR Egger, Weighted median, Inverse variance weighted and Weighted mode, and transformed for odd ratio and 95% CI.