Figures & data
Figure 1 Flow chart of the study population from the Danish National Birth Cohort (1996–2002).
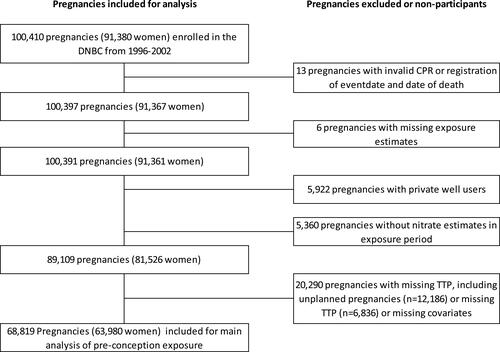
Table 1 Characteristics of the Female Study Population from the Danish National Birth Cohort (1996–2002) According to Preconception Drinking Water Nitrate
Table 2 Adjusted Risk Ratios for the Association Between Nitrate in Drinking Water and Time to Pregnancy Above 12 Months or Use of Medically Assisted Reproduction (MAR) Treatment, The Danish National Birth Cohort (1996–2002)
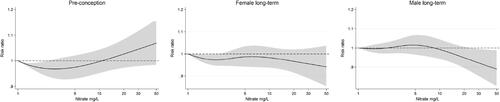
Figure 2 Adjusted risk ratios of time to pregnancy above 12 months or use of MAR treatment by drinking water nitrate exposure (log scale) with 1 mg/L as reference. Exposure below the highest detection limit 1 mg/L and above 50 mg/L is not shown but is included in the model. The gray scale area represents the confidence interval (CI). Female splines were adjusted for female age, education, occupation, population density, body mass index, smoking, and alcohol. Male splines were adjusted for male age and education and female population density, body mass index, smoking, and alcohol. Robust variance estimation (VCE) accounted for dependencies of pregnancies.