Figures & data
Table 1 Baseline Characteristics of Study Population
Table 2 Mean Differences (95% CI) for Metabolic Variables of Children Across Quartiles of Maternal E2 Levels
Table 3 Characteristics of Children Aged 2 to 3 Yrs
Table 4 Mean Differences (95% CI) for Metabolic Variables of Children Aged 2 to 3 Yrs Across Quartiles of Maternal E2 Levels
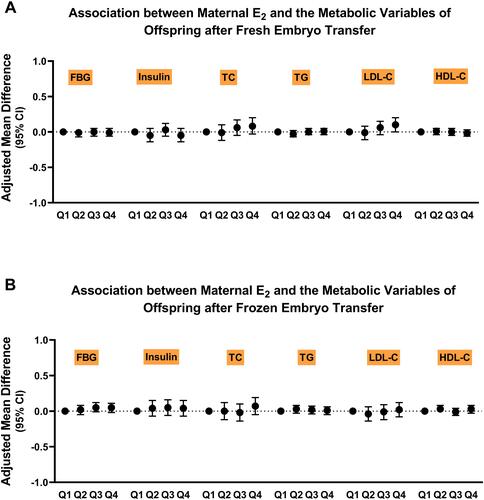
Figure 1 Differences in metabolic variables of children across quarters of maternal E2 levels stratified by embryo frozen Association between maternal E2 and metabolic variables in offspring after Fresh (A) and Frozen (B) embryo transfer.Abbreviations: FBG, fasting blood glucose; HDL-C, high-density lipoprotein cholesterol; LDL-C, low-density lipoprotein cholesterol; TC, total cholesterol; TG, triacylglycerol.