Figures & data
Figure 1 Flow chart of the study.
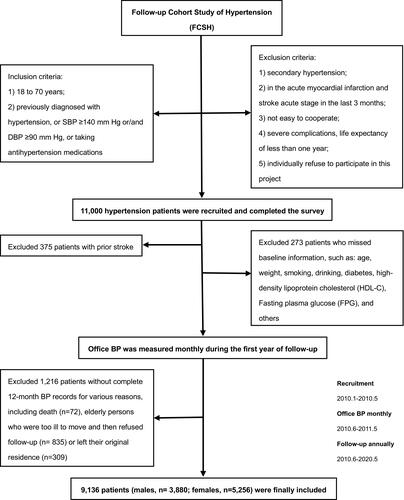
Table 1 Baseline Characteristics of the Study Sample
Table 2 Crude and Adjusted Stroke Hazard Ratios for Cumulative MAP Subgroups
Table 3 Multivariate Cox Proportional Regression Model Analysis of Stroke Risk Among Different Subjects (Sensitivity Analysis)
Table 4 Adjusted Ischemic Stroke Hazard Ratios for Cumulative MAP Subgroups Stratified by Sex, Age and BMI
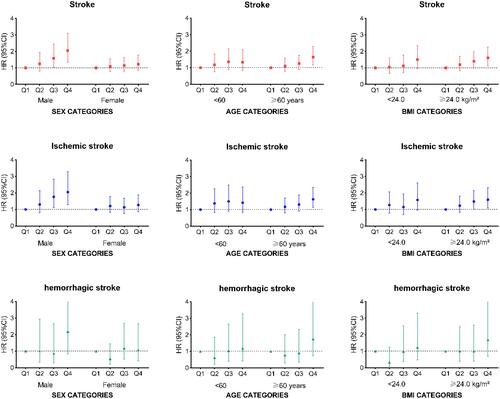
Figure 2 Subgroup analysis of the association between cumulative MAP quartile levels and stroke stratified by sex, age, and BMI.
Notes: Hazard ratios (HRs) and 95% CI of stroke by quartile levels of cumulative MAP (Q1, cum MAP ≤1050.08 mm Hg, n=2284; Q2, 1050.08 <cum MAP ≤1103.76 mm Hg, n=2284; Q3, 1103.76 <cum MAP ≤1156.35 mm Hg, n=2284; Q4, cum MAP >1156.35 mm Hg, n=2284).