
Figures & data
Table 1 Characteristics of Individuals with a GI Biopsy Result of Normal Mucosa and Their Matched References, a Nationwide Matched Cohort Study in Sweden, 1965–2016
Table 2 Mortality in Individuals with a GI Biopsy Result of Normal Mucosa and Their Matched References
Figure 1 The HR and 95% CI of all-cause and cause-specific mortality as a function of time since biopsy, comparing individuals with a GI biopsy result of normal mucosa with their matched references. Estimated by the flexible parametric model that conditioned on matching set (birth year, gender, county of residence, and calendar period) and further adjusted for country of birth, educational attainment, number of health care visits, Charlson comorbidity index, and history of GI diseases.
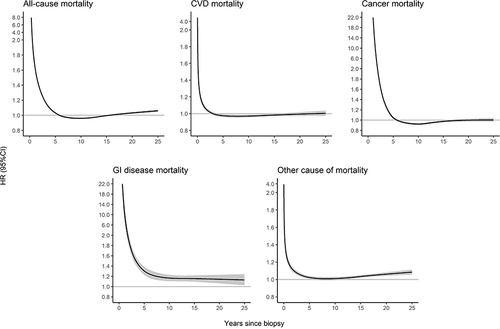
Figure 2 Subgroup analyses of the associations between normal mucosa and risk of mortality. Individuals biopsied in childhood (age at cohort entry<18 y) demonstrated a much higher risk for all-cause mortality (HR = 2.38; 95% CI: 2.11–2.69), cancer mortality (HR = 2.92; 95% CI: 2.11–4.05) and other cause of mortality (HR = 2.23; 95% CI: 1.95–2.56). Estimated by the flexible parametric model that conditioned on matching set (birth year, gender, county of residence, and calendar period) and further adjusted for country of birth, educational attainment, number of health care visits, Charlson comorbidity index, and history of GI diseases.
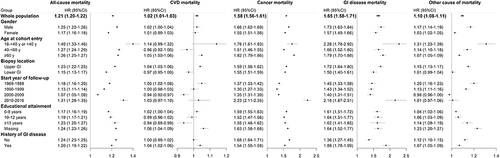
Table 3 Mortality in Individuals with a GI Biopsy Result of Normal Mucosa and Their Siblings