Figures & data
Figure 1 This example illustrates how the contact pattern might have been for an individual with multimorbidity in 2018: 6 contacts, 3 trajectories, 5 trajectory contacts, and 2 concurrent trajectories within 6 weeks from the most recent outpatient contact. The colored lines represent different trajectories, a green cross represents contact to outpatient clinic, and the gray vertical lines represent the number of weeks since the most recent outpatient contact in 2018.
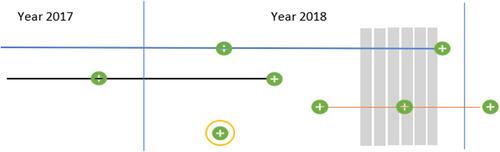
Table 1 Chronic Conditionsa in Individuals with Multimorbidity in Denmark, 1 January 2019
Table 2 Characteristics of All Individuals with Multimorbidity (≥2 Conditions) Living in Denmark on 1 January 2019
Table 3 Hospital Outpatient Trajectories and Related Trajectory Contacts from Individuals with Multimorbidity in 2018
Table 4 Outpatient Trajectories According to Disease System Categories in Adults with Multimorbidity in 2018
Figure 2 Lorenz diagram of the cumulated proportion of individuals with multimorbidity on 1 January 2019 according to the cumulated proportion of trajectory-related contacts in 2018.
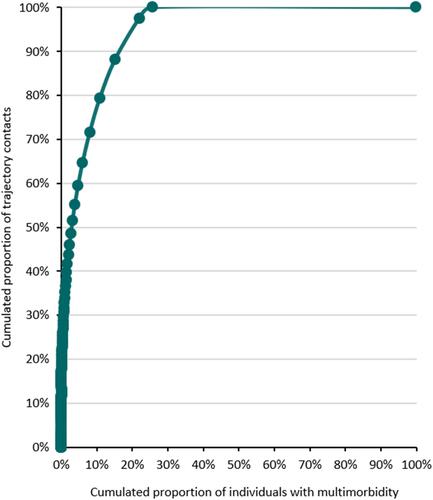
Figure 3 Histogram displaying the number of individuals in concurrent trajectories in 2018 according to different observation times, stratified by the number of concurrent trajectories.
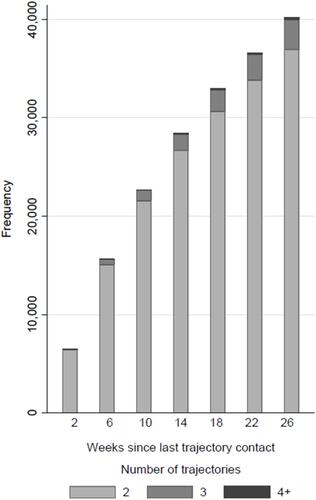
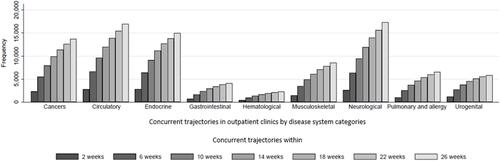
Figure 4 Bar plot of concurrent trajectories for 2018 according to different observation times, stratified by disease system category and the number of weeks since the most recent contact.