
Figures & data
Table 1 Characteristics of HF Patients with Incident AF and Matched Referents
Table 2 Differences in Marginal Cumulative Mortality Risks and Restricted Mean Survival Times Between HF Patients with and without AF
Figure 1 (A) Marginal survival curves, (B) marginal restricted mean survival times, and (C) difference between marginal restricted mean survival times with 95% confidence interval. Marginal curves adjusted for characteristics in .
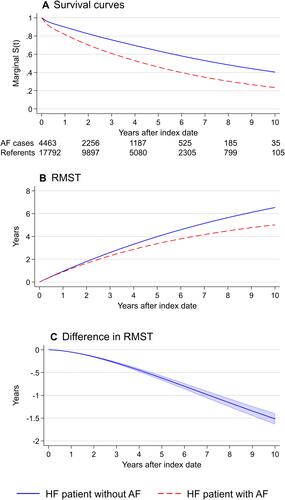
Table 3 Difference in Marginal Cumulative Mortality Risks and Restricted Mean Survival Times at 10 Years Between HF Patients with and without AF Among Subgroups