Figures & data
Table 1 Attrition Table
Table 2 Parameter Estimates from Continuity Prediction Model with Demographics
Table 3 Reclassification Table Comparing a Continuity Prediction Model with Demographics Terms versus Without Demographics Terms
Table 4 Difference in Measuring 40 Selected Variables in EHR vs EHR + Claims Dataa
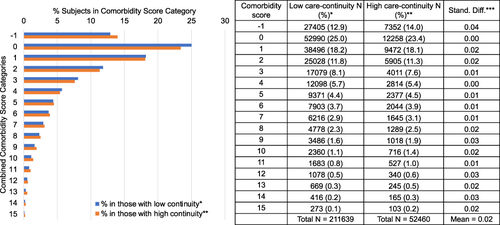
Figure 1 Misclassification among key variable groups by decile of predicted continuity. (A) Mean sensitivity for 15 medication use variables; (B) Mean standardized difference for 15 medication use variables; (C) Mean sensitivity for 25 comorbidity variables; (D) Mean standardized difference for 25 comorbidity variables.
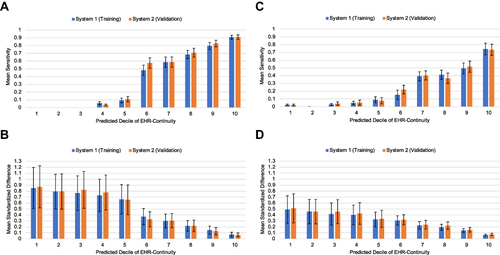
Figure 2 Representativeness: comparison of combined comorbidity score in those with high vs low data continuity. *Patients in the top 2 deciles of predicted care-continuity. **Patients in the remaining 8 deciles of predicted care-continuity. ***Stand diff: Standardized difference. Combined comorbidity score ranges between −2 to 26 with a higher score associated with higher mortality; smaller cell sizes were not presented here.