
Figures & data
Table 1 Demographic and Clinical Variables of the Study Population Stratified by Age Groups
Figure 1 Patient selection and age stratification.
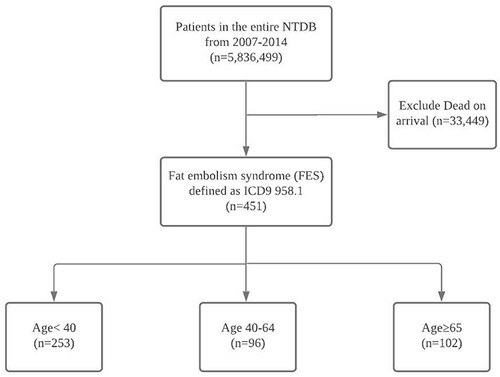
Table 2 Outcome Variables of the Study Population Stratified by Age Groups
Table 3 Injury Mechanism, Severity, and Type of the Study Population Stratified by Age Groups
Table 4 Fracture Location and Numbers Among Fat Embolism Syndrome Patients Stratified by Age Groups in the National Trauma Databank
Table 5 Odds Ratios for in Hospital Mortality, Hospital Non-Home Discharge, and Coefficients for Length of Stay, ICU Days and Ventilation Days, with Stratified Age Groups as Predictor, Among Fat Embolism Syndrome Patients. Covariates Included Were Sex, Race, Insurance Status, ISS, Mechanism of Injury, Emergency Department GCS Score, Comorbidities, Type of Fracture, Type of Procedure, Hospital Teaching Status and Hospital Bed Count
Table 6 Femoral Neck Fractures Compared to Other Femoral Fractures in Patients 65 and Older Who Developed FES