
Figures & data
Figure 1 Trends in the registration of neonatal phototherapy in the Danish National Patient Registry, nationwide and at selected Hospitals, during 2000–2016.
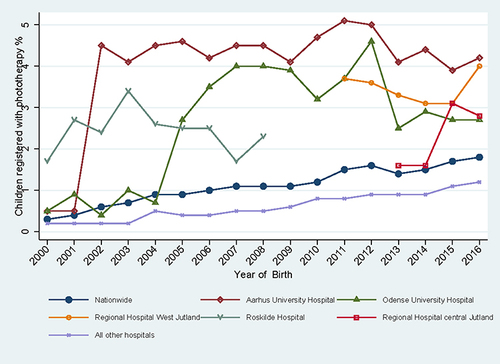
Table 1 Registration of Phototherapy According to Newborn Characteristicsa
Table 2 Proportion of Children Registered with Phototherapy According to Growth and Gestational Age (Preterm and Term)a
Figure 2 Trends in the registration of neonatal phototherapy, according to sex.
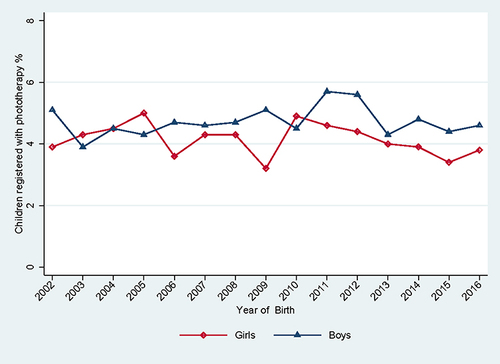
Figure 3 Trends in the registration of neonatal phototherapy, according to gestational age.
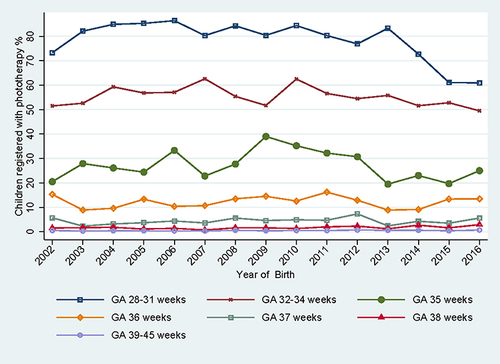
Figure 4 Trends in the registration of neonatal phototherapy, according to birth weight.
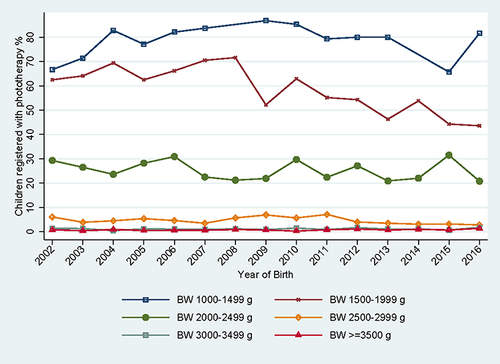
Figure 5 Trends in the registration of neonatal phototherapy, according to neonate size (SGA, AGA, LGA).
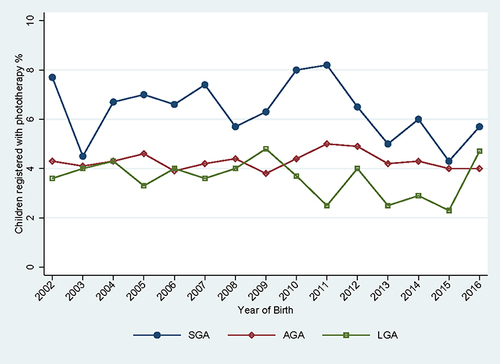
Table 3 Proportion of Children Registered with Phototherapy According to Gestational Age Among Singletons and Twinsa
Figure 6 Trends in the registration of neonatal phototherapy, according to the number of births in a pregnancy (singletons, twins+).
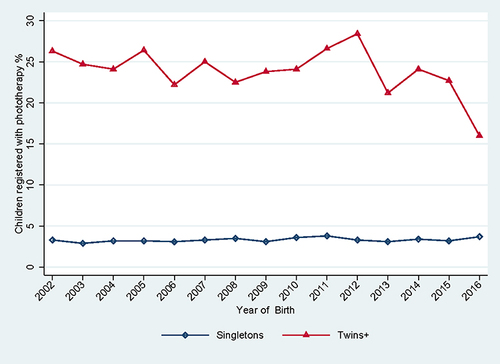
Figure 7 Trends in the registration of neonatal phototherapy, according to the parity of the mother.
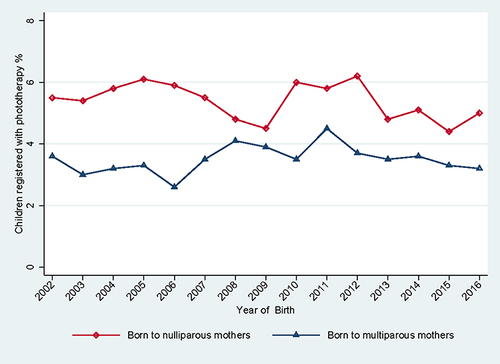
Table 4 Clinical Measurement of Bilirubin in the Neonatal Period According to Phototherapy and Gestational Agea