
Figures & data
Table 1 Baseline Demographic Characteristics and Cardiovascular Risk Factors of the Included Participants by Groups Depending on the Event That Occurred in the Follow-Up
Figure 1 Cumulative incidence of coronary events, stroke, other cardiovascular mortality, and cancer mortality during the follow-up. Incidence units are 1/100 inhabitants.
Abbreviation: CV, cardiovascular.
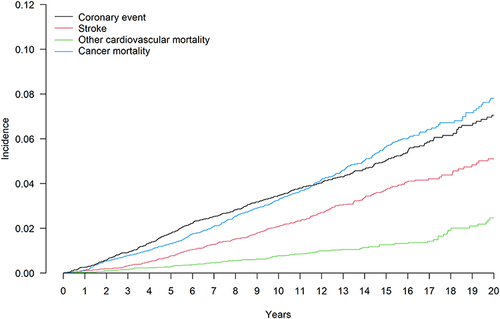
Table 2 Variable Estimates in the Models with Best Discrimination
Figure 2 Discrimination of the models.
Abbreviations: AUC, area under the receiver operating characteristic curve; CI, confidence interval; Ref, reference; REGICOR, Girona Heart Registry.
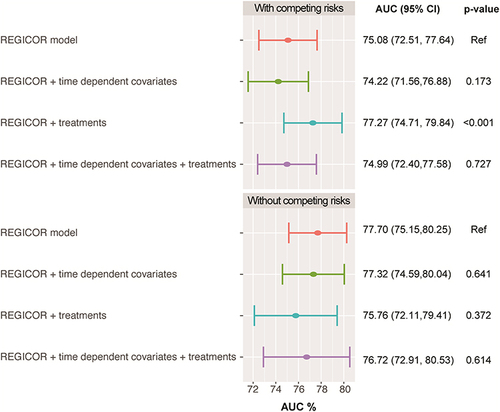
Table 3 Reclassification by the Categorical Net Reclassification Index Between the Basic Model with the Variables from the Framingham-REGICOR Function and the Models with and without Treatments, Time-Dependent Covariates and Competing Risks