Figures & data
Table 1 Study Definitions for Study on the Effectiveness of Lyme Vaccine
Table 2 Characteristics of Participants Enrolled in Lyme Vaccine Study by Case Status, N=912
Figure 1 Distribution of the vaccine’s effectiveness across all possible models.
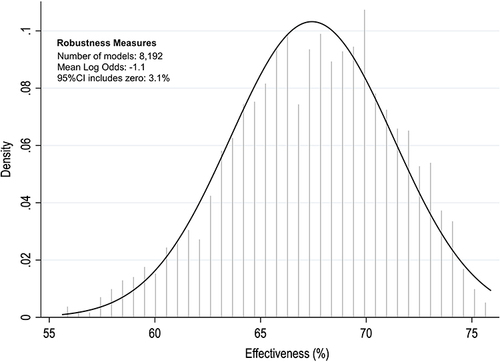
Figure 2 Vaccine effectiveness for model-averaged and the top subset of candidate models. *Excluded from BMA if PIP <0.01.
Abbreviations: AOR, adjusted odds ratio; VE, vaccine effectiveness; BMA, Bayesian model averaging; PIP, posterior inclusion probability.
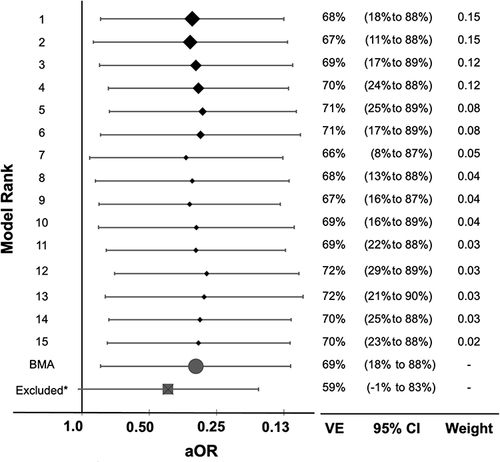
Figure 3 Composition and posterior inclusion probabilities of confounders among the top subset of models.
Notes: In this heat map, each row corresponds to a potential confounder, and each column corresponds to a particular model. The best model is on the left, and the worst model is on the right. The shade of each square represents the posterior probability of each potential confounder. The darker shades represent higher posterior probabilities, and unshaded squares represent variables that were not included in a given model. Since the immunization status was included in all models a priori, it is checkered, and the PIP for this variable is set to 1.
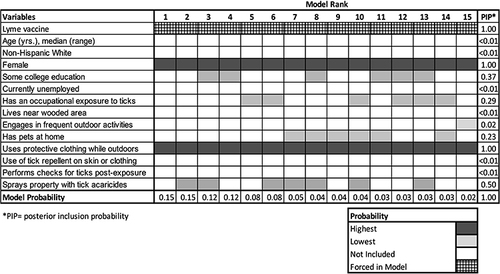
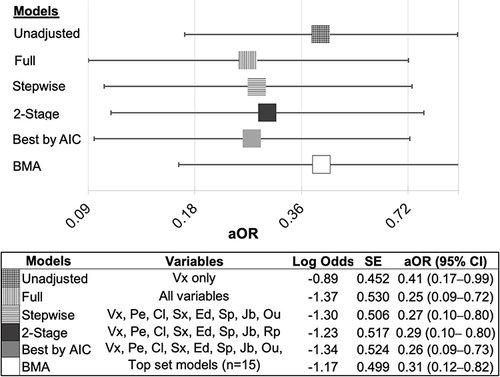
Figure 4 Comparison of single-model selection and Bayesian model-averaging approaches.
Abbreviations: Vx, vaccine status; Pe, has pets at home; Cl, wears protective clothing while outdoors; Sx, male or female sex; Ed, at least some college education; Sp, sprays property with acaricide; Jb, has job exposure to ticks; Ou, engages in frequent outdoor activities; Rp, use of tick repellent on skin or clothing; Tk, use of tick repellent on skin or clothing; SE, standard error; aOR, adjusted odds ratio; BMA, Bayesian model averaging; AIC, Akaike information criterion.