
Figures & data
Figure 1 Flowchart of the subcohorts from the Norwegian Women and Cancer (NOWAC) study for the analysis of life-course trajectories of physical activity (PA) and risk of melanoma, 1991–2018.
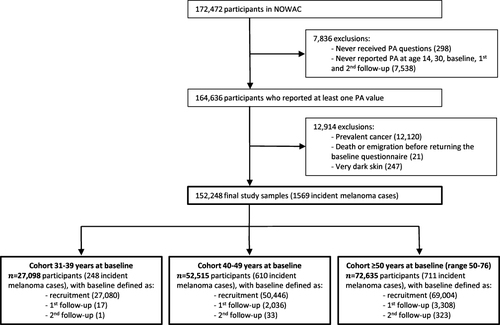
Table 1 Baseline Characteristics of the Study Sample from the Norwegian Women and Cancer Study (1991–2018, n = 152,248), Stratified by Subcohorts Labelled According to Age at Baseline
Figure 2 Class-specific average predicted life-course trajectories (bold lines) of physical activity for each subcohort: 31–39 years (A), 40–49 years (B) and ≥50 years (C) at baseline, the Norwegian Women and Cancer study, 1991–2018, n = 152,248.
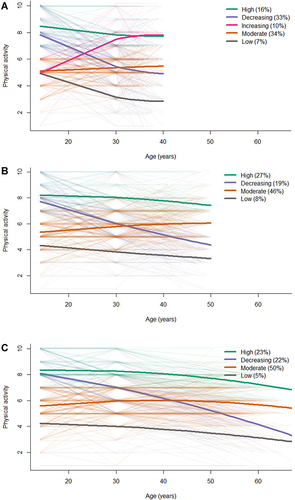
Figure 3 Sankey diagrams of physical activity trajectory classes obtained with latent class mixed model (LCMM) and naïve life-course trajectory analysis, for each subcohort: 31–39 years (A), 40–49 years (B) and ≥50 years (C) at baseline, in the Norwegian Women and Cancer study, 1991–2018, n = 137,800.
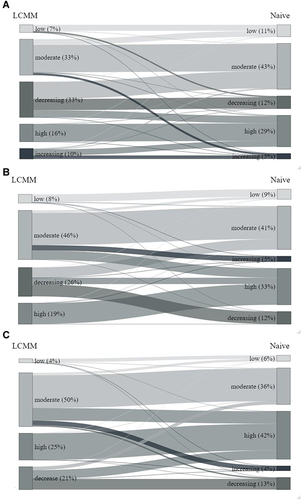
Table 2 Hazard Ratios (HRs) and 95% Confidence Intervals (CIs) for Melanoma Risk in Life-Course Physical Activity Trajectories (Latent Class Mixed Model) Using the Moderate Trajectory Class as Reference in Each Subcohort of the Norwegian Women and Cancer Study, 1991–2018, n = 130,259
Table 3 Hazard Ratios (HRs) and 95% Confidence Intervals (CIs) for Melanoma Risk in Life-Course Naïve Trajectories of Physical Activity Using the Moderate Trajectory Class as Reference for Each Subcohort in the Norwegian Women and Cancer Study, 1991–2018, n = 119,768