Figures & data
Table 1 Coding Algorithms Developed to Identify Patients with CD or UC from the Claims Database of Caserta LHU During the Years 2015–2018
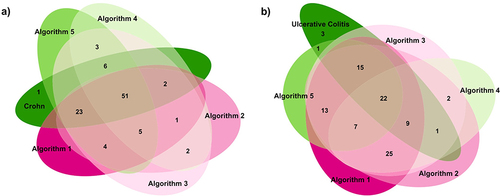
Figure 1 Flow-chart of patients identified in the gold standard cohort from Caserta LHU database in the period 2015–2018. *Unspecified diagnosis=IBD as indication for use, not specified if CD or UC.
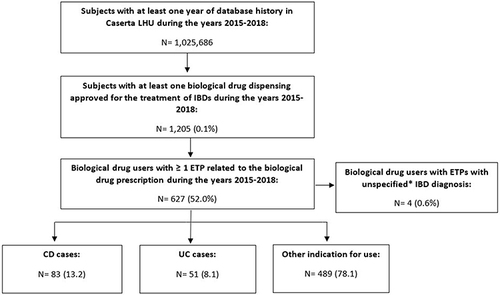
Table 2 Baseline Characteristics of IBD Biological Drugs Users, Stratified by Indication for Use, as Reported in the First Electronic Therapeutic Plan
Table 3 Diagnostic Accuracy of the Coding Algorithms Developed to Identify Patients with Crohn’s Disease in the Cohort of Biological Drug Users from Caserta LHU in the Years 2015–2018
Table 4 Diagnostic Accuracy of the Coding Algorithms Developed to Identify Patients with Ulcerative Colitis in the Cohort of the Biological Drug Users from Caserta LHU in the Years 2015–2018
Figure 2 Frequency distribution (Venn diagrams) of the number of biological drug users identified by the coding algorithms developed for Crohn’s disease (a) and ulcerative colitis (b) identification.