
Figures & data
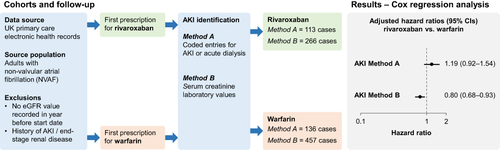
Figure 1 Flowchart illustrating the identification of the study cohorts. aA record of VTE or orthopaedic arthroplasty in the 3 months before the first OAC prescription or in the week after.
Abbreviations: AF, atrial fibrillation; eGFR, estimated glomerular filtration rate; IMRD, IQVIA Medical Research Data; NVAF, non-valvular atrial fibrillation, OAC, oral anticoagulant; SCr, serum creatinine.
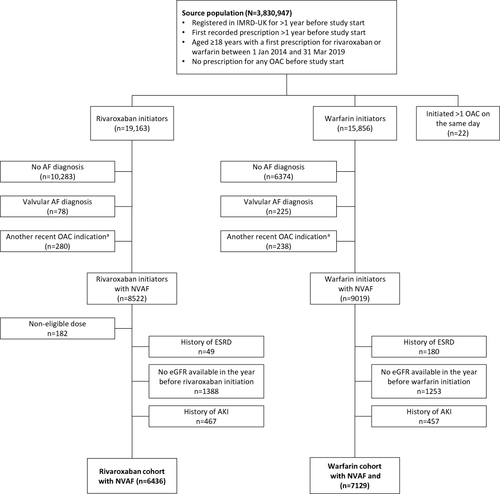
Table 1 Baseline Characteristics of the Study Cohorts
Table 2 Incidence Rate per 10,000 Person-Years of AKI, and HRs (95% CIs) Comparing AKI in the Rivaroxaban vs Warfarin Cohorts (ITT Analysis)
Table 3 Incidence Rate per 10,000 Person-Years of AKI and HR (95% CI) Comparing AKI in the Rivaroxaban vs Warfarin Cohorts, Stratified by Baseline Renal Function (ITT Analysis)