Figures & data
Table 1 Baseline Characteristics by Breast Cancer Diagnosis in Women with Type 2 Diabetes Mellitus
Figure 1 Flow chart of patient selection.
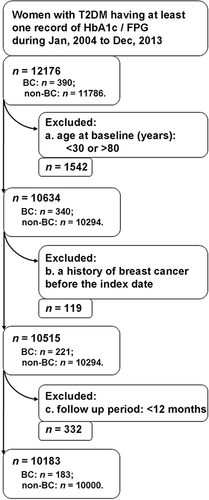
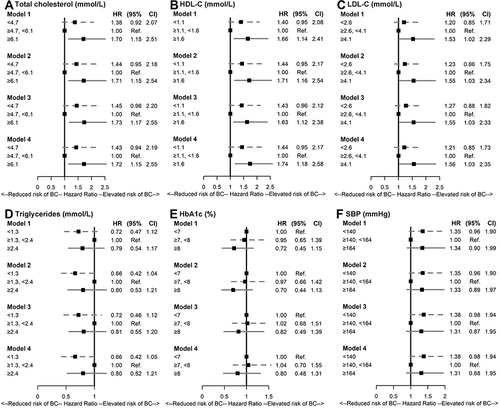
Figure 2 Forest plots of the multivariate analyses examining the associations of lipids, glycated hemoglobin A and systolic blood pressure with breast cancer risk. Associations of (A) total cholesterol, (B) HDL-C, (C) LDL-C, (D) triglycerides, (E) HbA1c and (F) SBP with breast cancer were indicated in HR and 95% CI. Model 1: adjusted for age and BMI; Model 2: adjusted for lipids, HbA1c and SBP (plus Model 1); Model 3: adjusted for metformin, non-metformin glucose-lowering medications, ACE-i or ARB, non-ACE-i or non-ARB antihypertensives, and statins (plus Model 1); Model 4: adjusted for any covariate with a P-value <0.2 in the univariate models.