Figures & data
Table 1 The Number, Crude Rate, Age-Standardized Rate, and Changing Trend of Bladder Cancer Burden in China from 1990 to 2019
Figure 1 Numbers and rates of incidence cases (A), death (B) and DALYs (C) of bladder cancer by age and sex in 2019 in China.
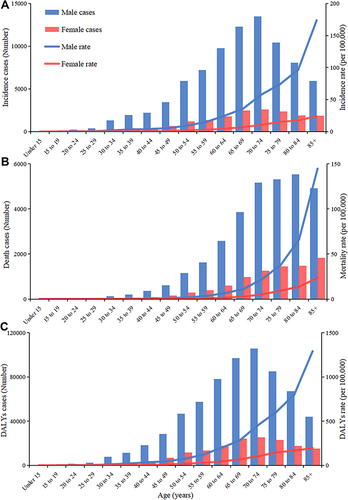
Figure 2 The incidence rate (A), mortality rate (B), and DALYs rate (C) of bladder cancer per 100,000 population by gender in different age groups, from 1990 to 2019.
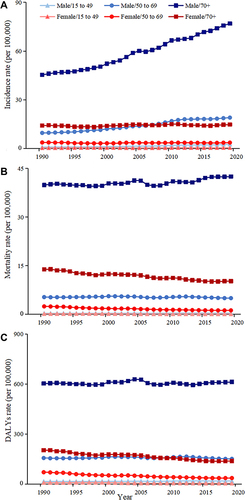
Figure 3 Proportions of DALYs for bladder cancer attributable to risk factors by age and sex in 2019.
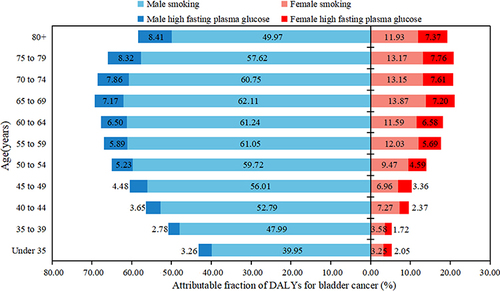
Figure 4 The trend of proportions of DALYs for bladder cancer attributable to risk factors by age and sex, from 1990 to 2019 in China.
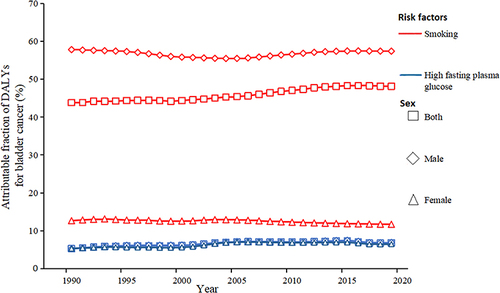
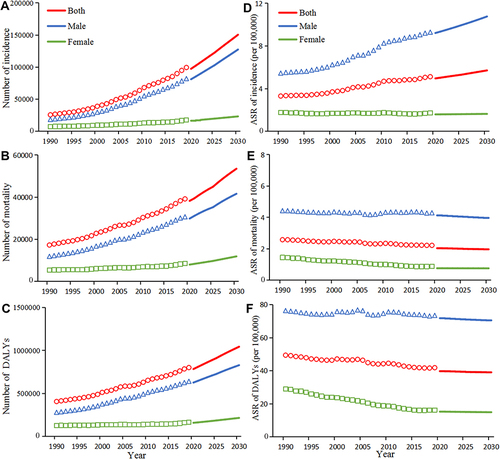
Figure 5 The projections of counts (A–C) and rates (D–F) of the burden of bladder cancer by gender in China from 2020 to 2030. The dots present the observed value. The solid lines present the predicted value.