Figures & data
Table 1 The Incident Cases and ASIR in 1990 and 2019 and Its Temporal Trends
Figure 1 The distribution and trends of colorectal cancer incidence globally. (A) Global number of incident cases and incidence rate of colorectal cancer per 100000 person-years by age and sex, 2019 (B) The ASIR in global, SDI regions, and 21 GBD regions by sex (C) The percentage change in ASIR of colorectal cancer for global and SDI regions by age from 1990 to 2019 (D) The EAPC of colorectal cancer ASIR in global, SDI regions, and 21 GBD regions by sex.
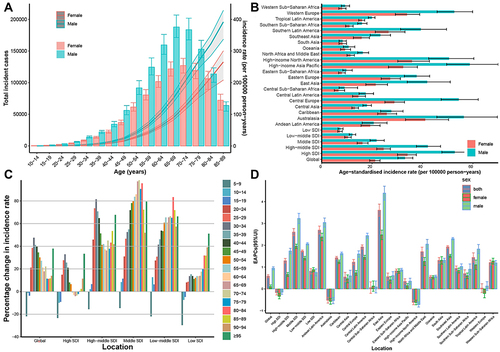
Figure 2 The trend in ASIR (A) and ASDR (B) of colorectal cancer across 21 GBD regions and global by SDI for both sexes combined, 1990–2019. For each region, points from left to right depict estimates from each year from 1990 to 2019.
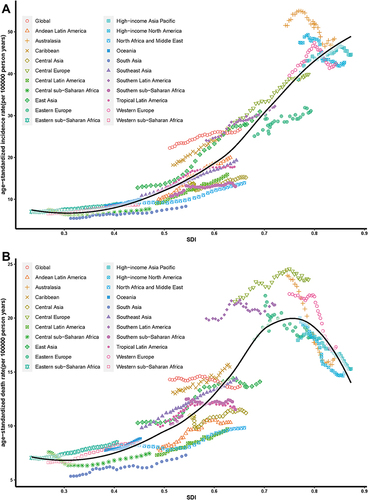
Figure 3 The global disease burden of colorectal cancer for both genders in 204 countries and territories. (A) The EAPC of Colorectal cancer ASIR from 1990 to 2019 (B) The EAPC of Colorectal cancer ASDR from 1990 to 2019 (C) The EAPC of Colorectal cancer age-standardized DALY rate from 1990 to 2019.
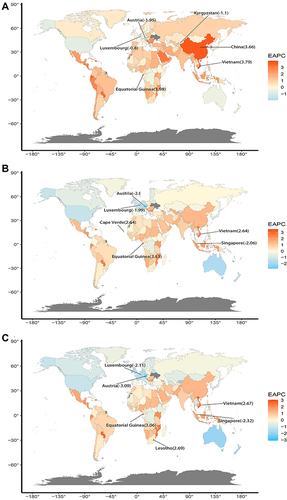
Table 2 The Death Cases and ASDR in 1990 and 2019 and Its Temporal Trends
Figure 4 The distribution and trends of colorectal cancer death globally. (A) Global number of deaths and death rate of colorectal cancer per 100000 person-years by age and sex, 2019 (B) The ASDR in global, SDI regions, and 21 GBD regions by sex (C) The percentage change in ASDR of colorectal cancer for global and SDI regions by age from 1990 to 2019 (D) The EAPC of colorectal cancer ASDR in global, SDI regions, and 21 GBD regions by sex.
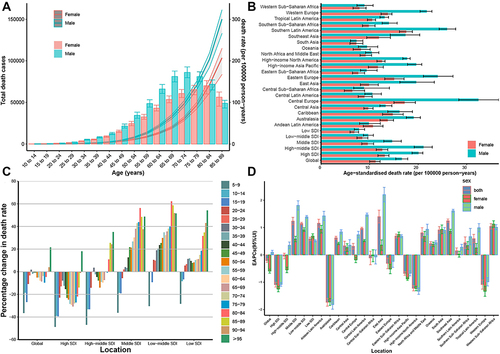
Table 3 The DALY and Age-Standardized DALY Rate in 1990 and 2019 and Its Temporal Trends
Figure 5 The observed (dashed line) and predicted (solid line) cases (A) and deaths (B) of colorectal cancer from 1990 to 2044. The upper bound of Shading represents the rate increased by 1% per year (pessimistic reference) and the lower bound represents decreased by 1% per year (optimistic reference) based on the rate observed in 2019.
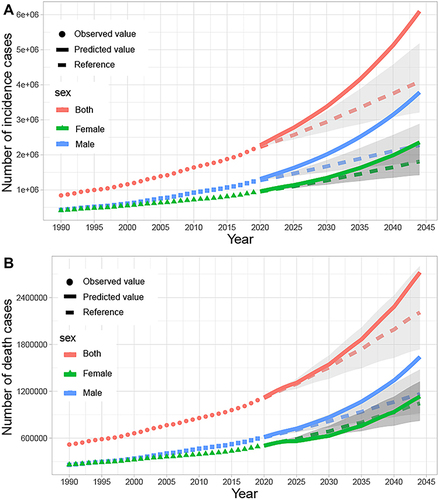
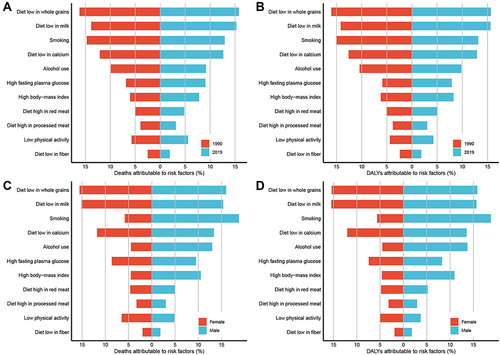
Figure 6 Percentage of attributable to risk factors of colorectal cancer in different year or gender. (A) deaths attributable to risk factors between 1990 and 2019 (B) deaths attributable to risk factors between 1990 and 2019 (C) deaths attributable to risk factors between different gender in 2019 (D) deaths attributable to risk factors between different gender in 2019.