Figures & data
Figure 1 Number of persons registered in the PHARMO GP data at each year (2004–2020).
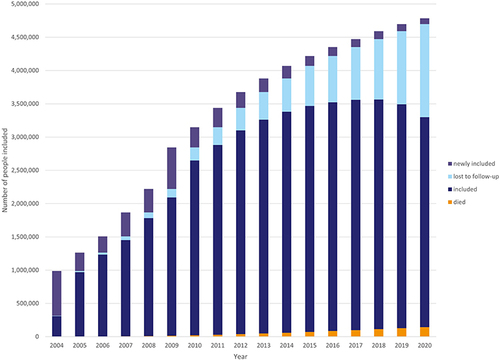
Table 1 Demographic Characteristics of the Population in PHARMO GP Data, the Netherlands and Nivel at January 1st, 2018
Figure 2 Population pyramid of the PHARMO GP population (A) and the Dutch population (B) at January 1st, 2018.
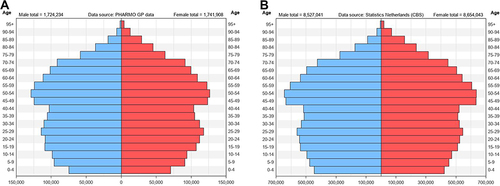
Figure 3 Medication use per pharmacological subgroup (ATC 3rd level) in the PHARMO GP data and the Netherlands in 2018 with absolute std.diff ≥0.05.
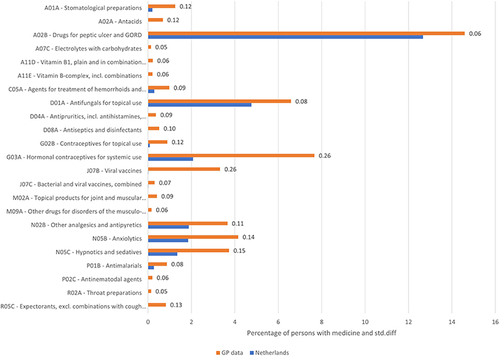
Figure 4 Continued.
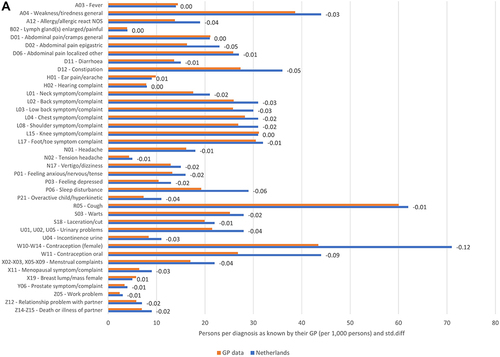
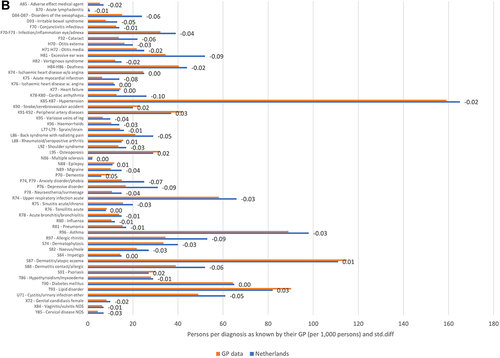
Figure 4 Symptoms and complaints (A) and diagnoses (B) per ICPC level in the PHARMO GP data and the Netherlands in 2018.