
Figures & data
Table 1 Average Annual Percent Change of Epidemiological Metrics of Total CRC and EOCRC in China from 1990 to 2019
Figure 1 Prevalence and age-standardized prevalence rate (A and B), incidence and age-standardized incidence rate (C and D) of total CRC and EOCRC by sex from 1990 to 2019 in China.
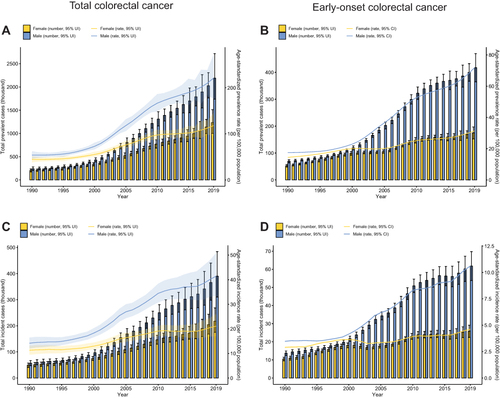
Figure 2 Number of deaths and age-standardized mortality rate (A and B), total DALYs and age-standardized DALYs rate (C and D) of total CRC and EOCRC by sex from 1990 to 2019 in China.
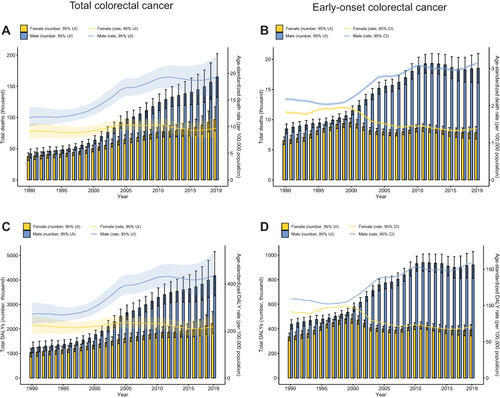
Figure 3 Observed and forecasted temporal trends of age-standardized rates of incidence and death (A and B), incident cases (C and D), and deaths (E and F) of total CRC and EOCRC by sex from 1990 to 2044 in China.
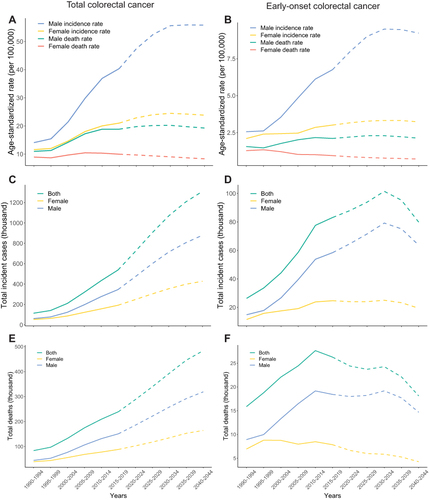
Table 2 Observed Number of Incident Cases and Deaths of Total CRC and EOCRC for Both Sex from 1990 to 2019 and Its Prediction from 2020 to 2044