Figures & data
Table 1 Baseline Characteristics of Overall Study Population
Figure 1 Adjusted HRs by HbA1c level for (A) all-cause mortality, (B) IHD, (C) AMI, (D) PAD, (E) haemorrhagic stroke and (F) ischemic stroke.
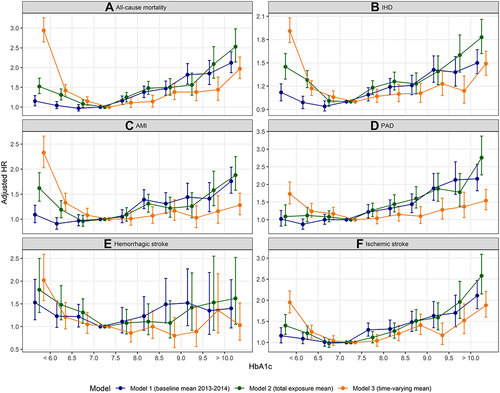
Figure 2 Adjusted HRs by HbA1c level, with HVS included in the model, for (A) all-cause mortality, (B) IHD, (C) AMI, (D) PAD, (E) haemorrhagic stroke and (F) ischemic stroke.
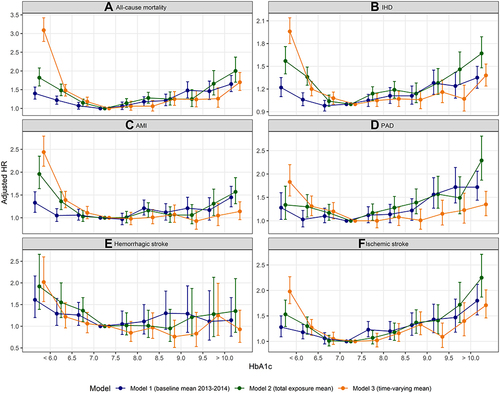
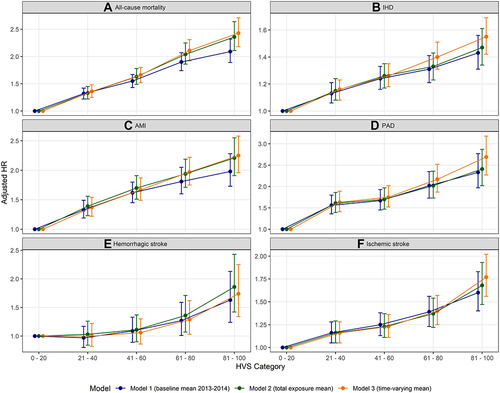
Figure 3 Adjusted HRs by HbA1c Variability Score, for (A) all-cause mortality, (B) IHD, (C) AMI, (D) PAD, (E) haemorrhagic stroke and (F) ischemic stroke.