Figures & data
Table 1 Basic Characteristics of Included Studies
Figure 1 Flow chart of the study selection process.
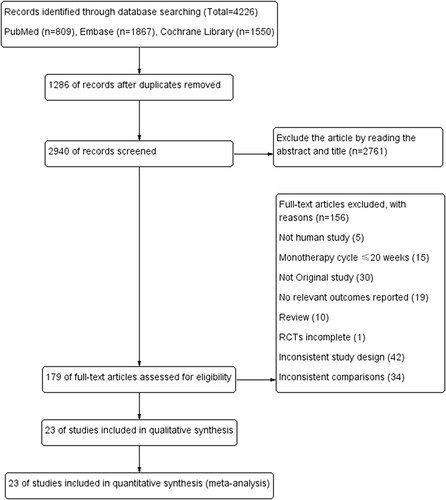
Figure 2 Risk of bias assessment plots.
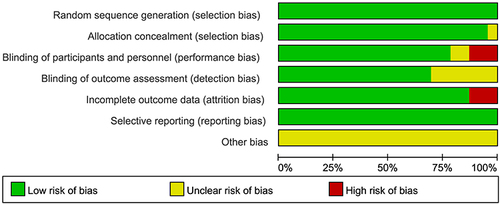
Figure 3 Risk of bias summary plots.
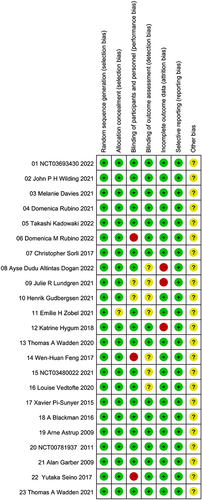
Figure 4 Network plot. (A) (Weight loss), (B) (decreased HbA1c), (C) (total adverse events), (D) (serious adverse events), (E) (hypoglycemic events).
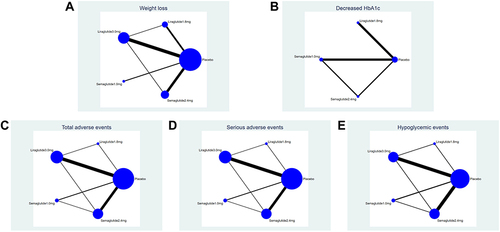
Table 2 Design-by-Treatment Test
Table 3 The Inconsistency of Loop-Specific Approach for Efficacy and Safety
Table 4 Comparisons for the Weight Loss of the Four Interventions
Table 5 The SUCRA (%) Results of Network Meta of the 5 Outcome Indicators
Figure 5 Cumulative probability plots. (A) (Weight loss), (B) (decreased HbA1c), (C) (total adverse events), (D) (serious adverse events), (E) (hypoglycemic events).
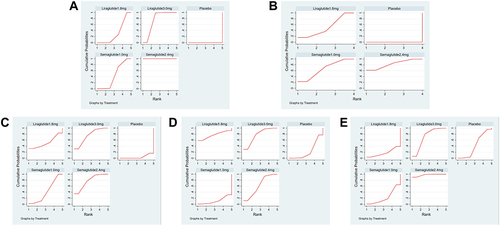
Table 6 Comparisons for the Δ HbA1c (%) of the Three Interventions
Table 7 Comparisons for the Total Adverse Events of the Four Interventions
Table 8 Comparisons for the Serious Adverse Events of the Four Interventions
Table 9 Comparisons for the Hypoglycemic Episodes of the Four Interventions
Table 10 Comparisons for the Weight Loss of the Four Interventions After 6 High-Risk Studies Were Excluded
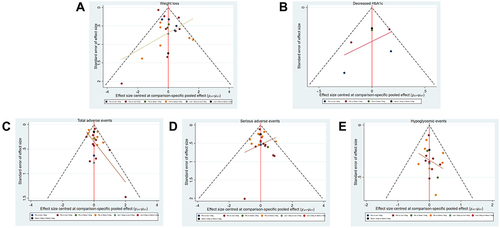
Figure 6 Funnel plots. (A) (Weight loss), (B) (decreased HbA1c), (C) (total adverse events), (D) (serious adverse events), (E) (hypoglycemic events).