
Figures & data
Figure 1 Flowchart of study population derivation.
Abbreviations: HER, electronic health records; ESKD, end-stage kidney disease; BAP, baseline assessment period.
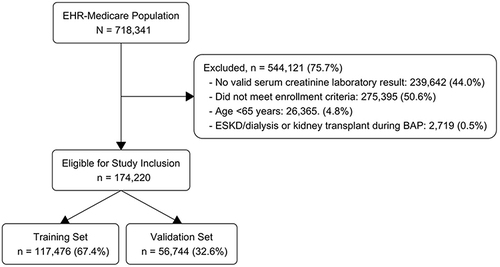
Table 1 Patient Characteristics in the Training and Validation Sets (N = 174,220)
Figure 2 Mean measured eGFR by predicted eGFR decile in the training vs validation sets. Error bars represent standard deviations.
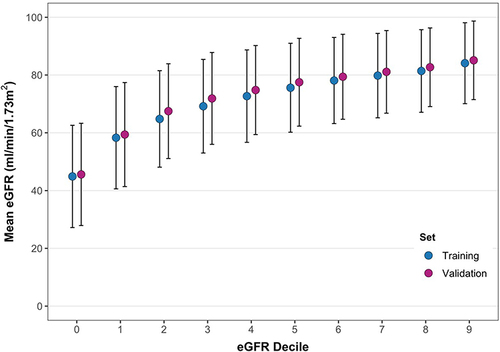
Table 2 Performance of the Model Predicting eGFR <60 and <45 mL/min/1.73m2 Categories
Figure 3 Area under the receiver operating characteristic (AUROC) curves of the performance of the eGFR prediction tool in the training and validation set.
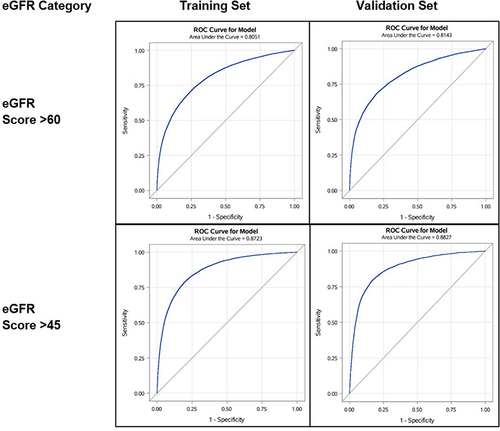
Table 3 Performance of the Prediction Model for eGFR <30 mL/min/1.73m2