Figures & data
Table 1 Characteristics of the Study Population
Table 2 Slopes (95% CIs) of the Association Between Anthropometric Indices and Lipids Among Individuals Below or Above the Estimated Break Point
Figure 1 LOESS regressions between anthropometric indices and LDL cholesterol. (A) Body mass index and LDL cholesterol; (B) waist circumference and LDL cholesterol; (C) waist-to-hip ratio and LDL cholesterol.
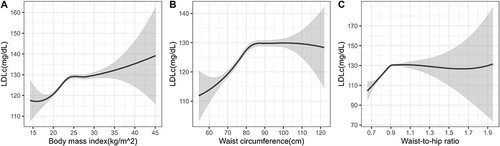
Figure 2 LOESS regressions between anthropometric indices and atherogenic lipids. (A) Body mass index and HDL cholesterol; (B) waist circumference and HDL cholesterol; (C) waist-to-hip ratio and HDL cholesterol; (D) body mass index and triglycerides; (E) waist circumference and triglycerides; (F) waist-to-hip ratio and triglycerides; (G) body mass index and triglycerides-to-HDL cholesterol ratio; (H) waist circumference and triglycerides-to-HDL cholesterol ratio; (I) waist-to-hip ratio and triglycerides-to-HDL cholesterol ratio.
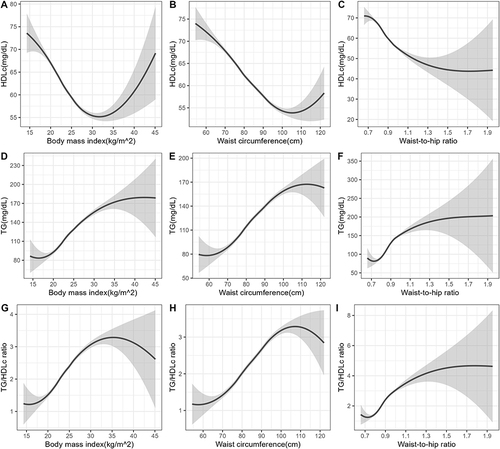
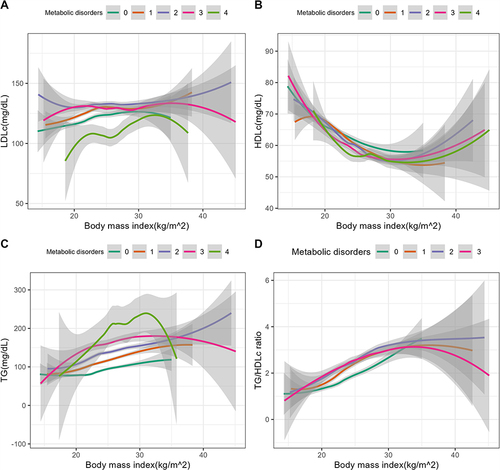
Table 3 Slopes (95% CIs) of the Association of Body Mass Index with Lipids Stratified by Number of Metabolic Disorders
Figure 3 LOESS regressions between body mass index and lipids, stratified by number of metabolic disorders. (A) Body mass index and LDL cholesterol; (B) body mass index and HDL cholesterol; (C) body mass index and triglycerides; (D) body mass index and triglycerides-to-HDL cholesterol ratio.