Figures & data
Table 1 The Number of Incident Cases and the Age‐standardized Incidence Rates of Kidney Cancer in China in 1990 and 2019 and the Estimated Annual Percentage Changes from 1990 to 2019
Table 2 The Number of Deaths and the Age‐standardized Mortality Rates of Kidney Cancer in China in 1990 and 2019 and the Estimated Annual Percentage Changes from 1990 to 2019
Table 3 The Number of DALYs and the Age‐standardized DALYs Rates of Kidney Cancer in China in 1990 and 2019 and the Estimated Annual Percentage Changes from 1990 to 2019
Figure 1 Disease burden of kidney cancer in 2019 in China. Numbers and rates of incidence (A), mortality (B), and DALYs (C) of kidney cancer by age and sex in 2019 in China. Shading represents the upper and lower limits of the 95% uncertainty intervals (95% UIs). DALYs, disability-adjusted life-years.
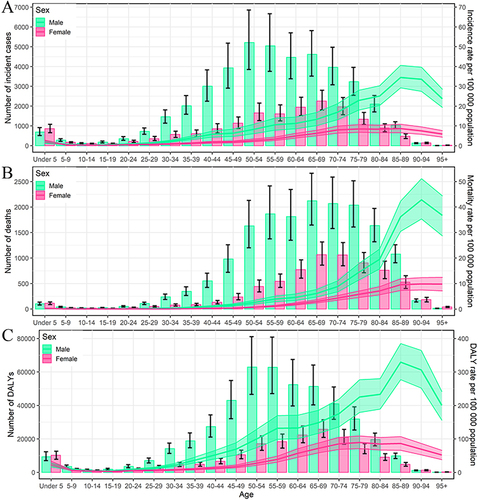
Figure 2 Temporal trends in kidney cancer burden from 1990 to 2019 in China. The number of incident cases (A), incidence rate (B) of kidney cancer by age and sex, from 1990 to 2019 in China; EAPC of incidence rate (C) of kidney cancer by age and sex in 2019 in China. EAPC, estimated annual percentage change.
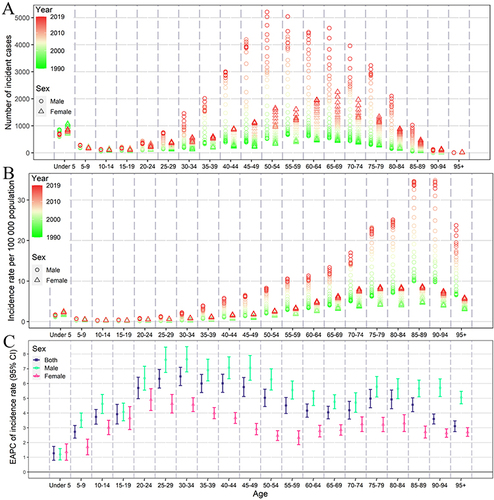
Figure 3 The province-level burden of kidney cancer in 2017 in China. Age-standardized DALY rate per 100,000 population by the province of China in 2017 (A) and age-standardized DALY rates for kidney cancer and SDI by province, for 2017 (B). DALY, disability-adjusted life-years, ASDR, age-standardized DALY rate, SDI, social-demographic index.
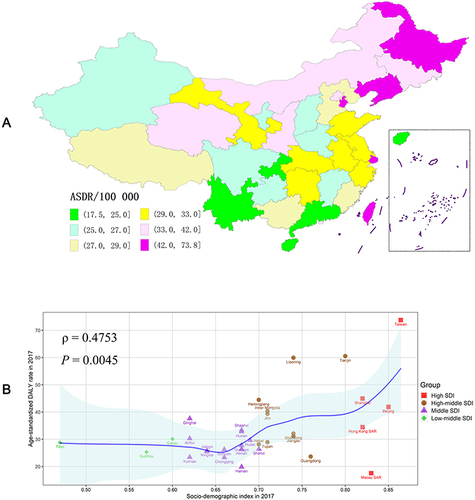
Figure 4 Risk factor analysis for kidney cancer in China. Proportions of DALYs of kidney cancer attributable to risk factors by sex from 1990 to 2019 in China (A); and proportions of DALYs attributable to risk factors by age and sex in 2019 in China (B). DALYs, disability-adjusted life-years.
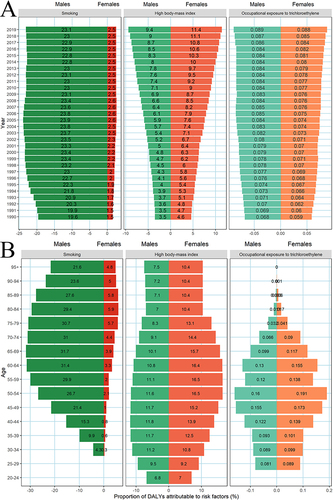
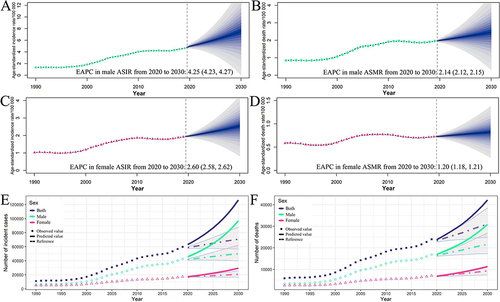
Figure 5 Predictions of kidney cancer incidence and death rates in China until 2030. Temporal trends and projected age-standardized incidence rate and age-standardized death rate by sex, from 1990 to 2030 in China (A and B for male, C and D for female); Trends in observed (dashed lines) and projected (solid lines) kidney cancer in the number of incidence cases (E) and deaths (F) from 1990 to 2030. Shading represents a 2% decreasing and increasing interval based on the 2019 rate.