Figures & data
Figure 1 Exposure measurement in the ACT-FLARE study.Citation8 The exposure frequency question wording was slightly different across the Baseline, Scheduled and Event-Driven questionnaires. The response options for each of the exposures measured were consistent.
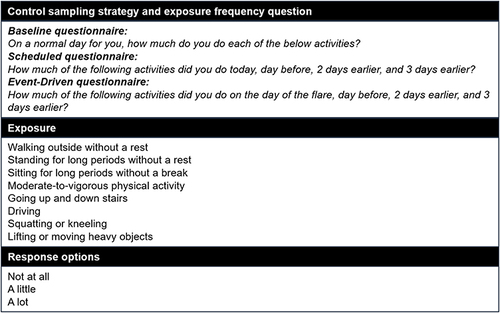
Figure 2 Schematic representation of the three control period sampling strategies employed in the ACT-FLARE study.Citation8 Strategy 1 represents a participant who reported a flare and provided bi-directional control exposure measurements by completing 4 Scheduled questionnaires; strategy 2 represents a participant who reported a flare and provided control exposure measurement from the Baseline questionnaire; strategy 3 represents a participant who reported a flare and provided control measurement as part of the same Event-Driven questionnaire.
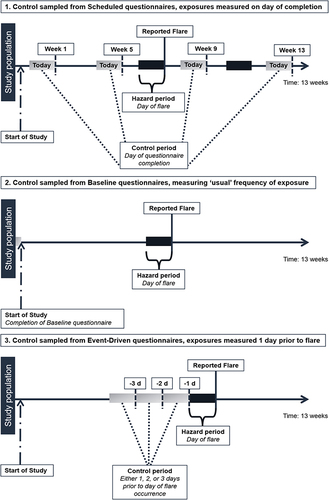
Figure 3 Exposure frequencies across the three control sampling strategies. CSS1: Control sampling strategy 1: Four Scheduled questionnaires, with exposures measured on day of questionnaire completion. CSS2: Control sampling strategy 2: Baseline questionnaire, measuring “usual” frequency of exposure. CSS3: Control sampling strategy 3: Event-Driven questionnaire, with exposures measured one day prior to flare occurrence.
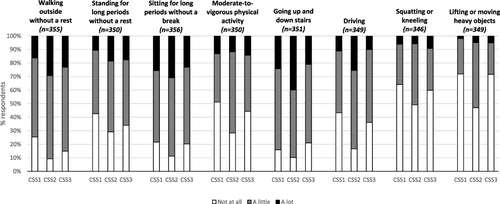
Table 1 Comparison of Physical Activity Exposure Odds Ratios and Standard Errors Across Each Control Sampling Strategy (1:1 Matching, Pair-Interval Matched Approach)
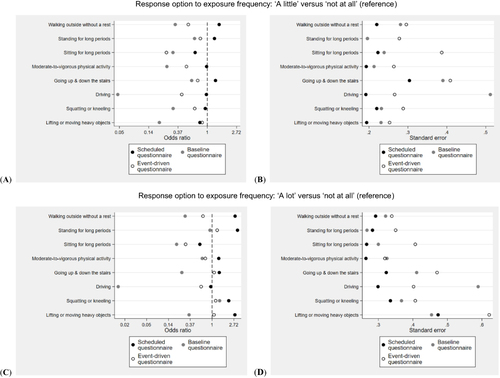
Figure 4 Comparison of effect estimates across the three control sampling strategies (1:1 matching). (A) odds ratio point estimates for exposure frequency: “A little” versus “not at all” (reference), (B) standard errors for exposure frequency: “A little” versus “not at all” (reference), (C) odds ratio point estimates for exposure frequency: “A lot” versus “not at all” (reference), (D) standard errors for exposure frequency: “A lot” versus “not at all” (reference).