Figures & data
Table 1 Demographics and Sample Characteristics by NSAID User Category
Table 2 Prevalence of Reported NSAID Use and Psychometric Values of Dispensed NSAIDs in the 90 Days Preceding a First-Line Intervention to Identify People Reporting Use of NSAIDs
Figure 1 Study flowchart.
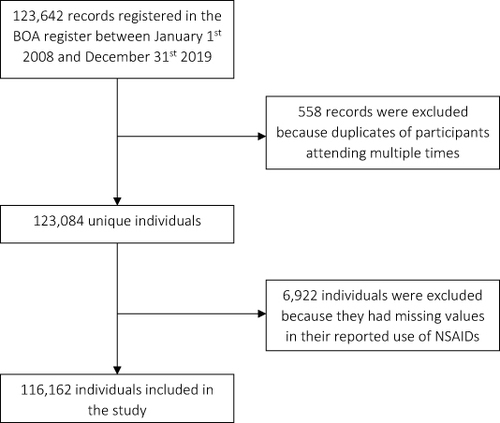
Figure 2 Prevalence of NSAID use in the whole sample and in age and pain categories. Confidence intervals of the estimate can be found in the Supplementary File 2.
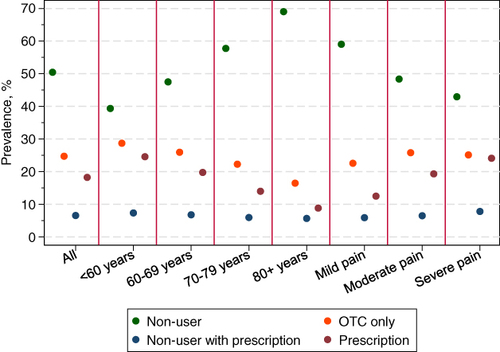
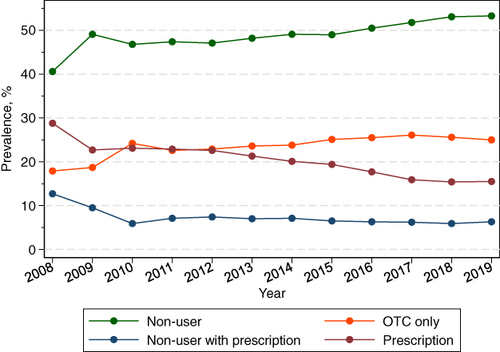
Figure 3 Prevalence of NSAID-user categories by calendar year. Confidence intervals of the estimate can be found in the Supplementary File 4.