Figures & data
Table 1 Pre-Specified and Refined Indicators of Testicular Cancer Relapse, and Different Versions of the Algorithm Based on the Various Indicators
Table 2 Characteristics of the Study Cohort, and Stratified by Data Cohort
Figure 1 Flowchart of the study population.
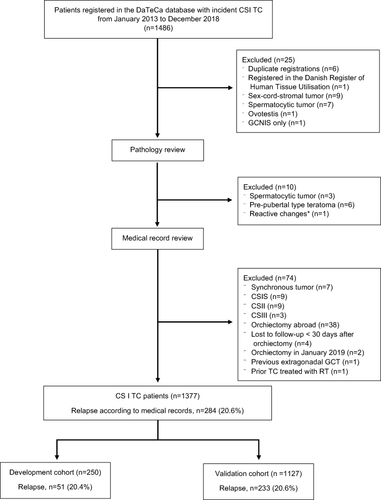
Table 3 Concordance of Relapse Identified by the Gold Standard and Registered in the DaTeCa Database (n = 1377)
Table 4 Performance of Different Versions of the Algorithm to Identify Patients with Relapse from Stage I Testicular Cancer in the Development Cohort (n = 250)
Table 5 Concordance of Relapse Identified by the Gold Standard and the Final Algorithm (Algorithm 5) in the Validation Cohort (n = 1127)
Table 6 Performance of the Final Algorithm (Algorithm 5) in the Validation Cohort (n = 1127) to Identify Patients with Relapse from Stage I Testicular Cancer
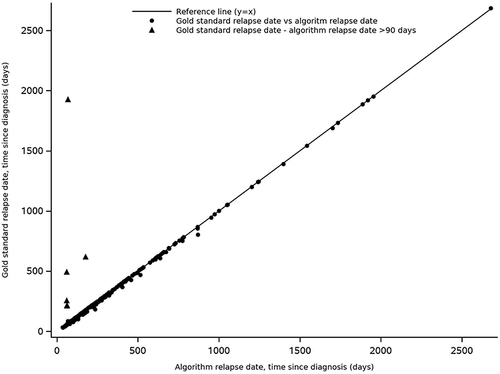
Table 7 Accuracy of Relapse Date as Estimated from the Final Algorithm (Algorithm 5) Compared with the Gold Standard in the Full Study Cohort (n = 1377)
Figure 2 Concordance of relapse date between the final algorithm (algorithm 5) and by the gold standard.