Figures & data
Table 1 The Numbers and Age-Standardized Rates of Incidence, Deaths, Prevalence, YLLs, YLDs, and DALYs of IBD in China in 1990 and 2019, and the AAPCs from 1990 to 2019
Figure 1 The numbers and age-standardized rates of incidence (A), deaths (B), prevalence (C), DALYs (D), YLLs (E), and YLDs (E) of IBD in China from 1990 to 2019.
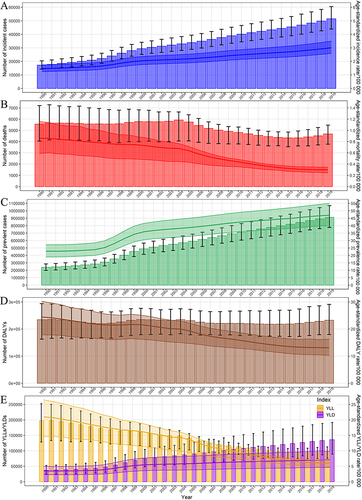
Figure 2 The AAPC of burden rate of IBD by age and indicators related to disease burden in China from 1990 to 2019 (A). The gradual incidence rate (B), mortality rate (C), and DALY rate (D) of IBD by age and gender in China from 1990 to 2019. The gradual change in color from green to red reflects the annual trend of the burden rate of IBD in each age group and gender from 1990 to 2019.
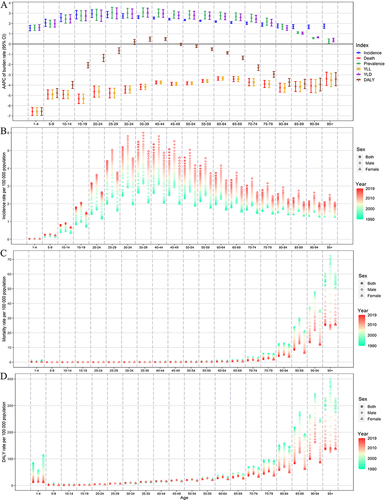
Figure 3 The national numbers and age-standardized rates of incidence (A), deaths (B), prevalence (C), YLLs (D), YLDs (E), and DALYs (F) of IBD by age and gender in 2019.
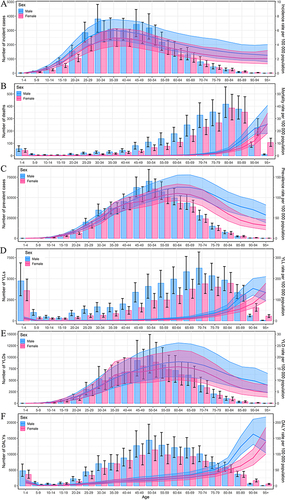
Figure 4 The geographical distribution of the ASDR of IBD in 2017 in China (A). The ASDR of IBD for 34 province-level administrative units by different SDI groups in 2017 (B).
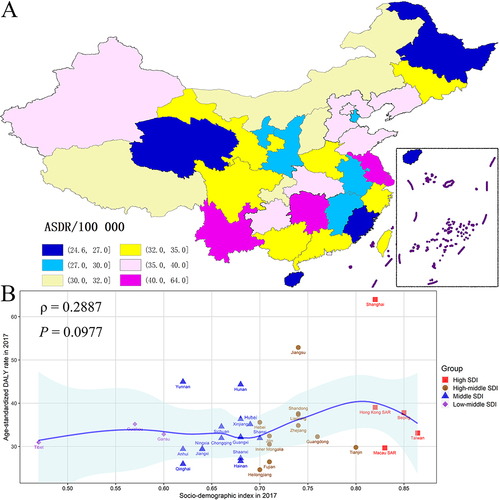
Figure 5 The temporal trends of age-standardized burden rates from 1990 to 2019 in China, South Korea, Japan, the European Union, the USA, and worldwide.
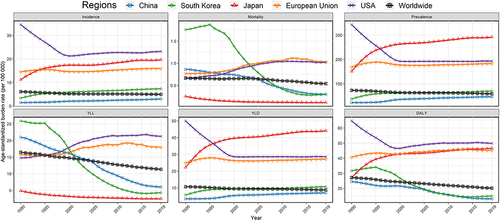
Figure 6 The geographical variation in IBD of ASIR (A), AAPC in ASIR (B), ASDR (C), and AAPC in ASDR (D) across countries and regions in 2019.
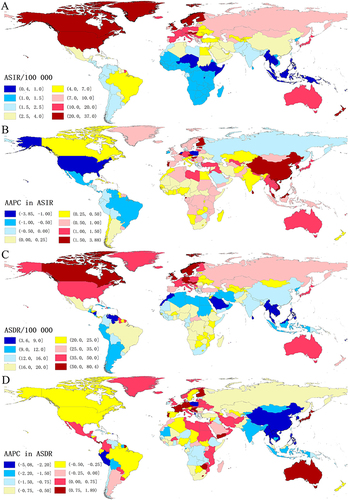
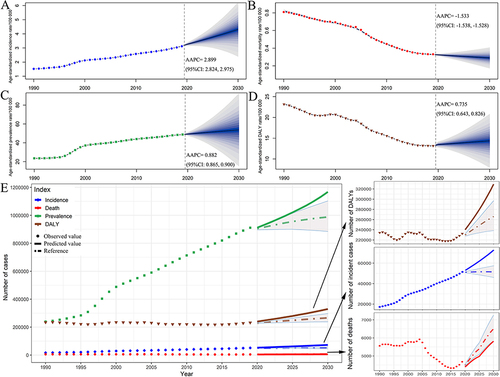
Figure 7 The temporal trends of the national disease burden of IBD from 1990 to 2019, and projections until 2030. Age-standardized incidence rate (A), age-standardized mortality rate (B), age-standardized prevalence rate (C), age-standardized DALY rate (D), and numbers of incident cases, deaths, prevalent cases, and DALYs (E).