Figures & data
Table 1 The Prevalence Numbers and Age-Standardized Prevalence of Cataract in 1990 and 2019, and Its Temporal Trends from 1990 to 2019
Figure 1 The age-specific prevalence rate and DALYs rate of cataract by age and gender in China (A and B) and globally (C and D) in 2019. DALYs, disability-adjusted life years.
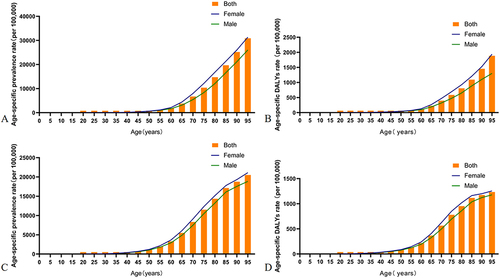
Figure 2 The age-standardized prevalence rate and burden of cataract in 1990–2019 by different regions (A and B), by different levels of income regions (C and D), by different levels of SDI regions (E and F). SDI, Socio-Demographic Index.
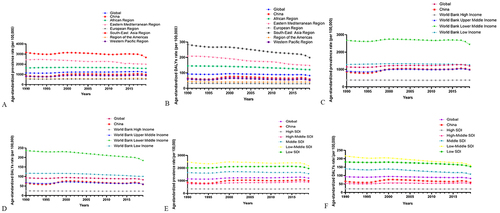
Figure 3 Proportion of cataract DALYs attributable to four risk factors, for global, China and 15 regions in 1990 and 2019 by sex: (A) Male, (B) Female. Injuries, and Risk Factors Study.
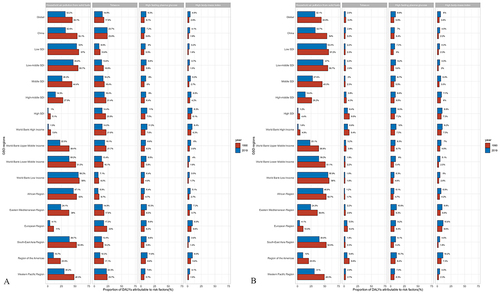
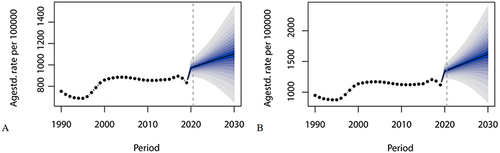
Figure 4 The change trends of the cataract-related disease burden by sex from 1990 to 2030 in China: (A) Male, (B) Female.