Figures & data
Figure 1 Study cohort description.
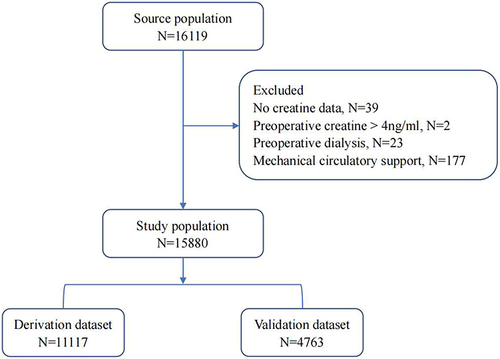
Table 1 Baseline Characteristics of Patients Undergoing Cardiac Surgery in Derivation and Validation Cohorts
Table 2 Baseline Characteristics in Derivation Cohort
Table 3 Prediction Performance of the Models
Figure 2 Comparison of AUC between LR and Xgboost models in predicting postoperative AKI. (a) derivation cohort. (b) testing cohort.
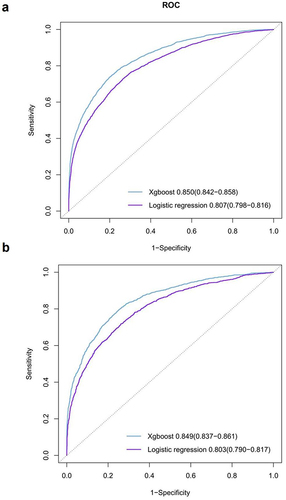
Figure 3 Calibration plot of Logistic regression ((a) derivation cohort, (c) testing cohort) and Xgboost model ((b) derivation cohort, (d) testing cohort).
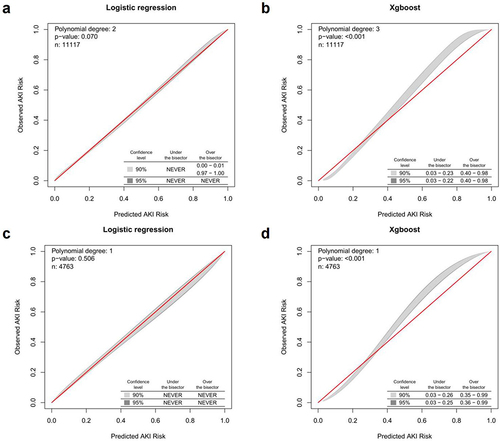
Figure 4 (a) sHapley Additive exPlanations (SHAP) summary plot of the top 15 features in the Xgboost model. The higher the SHAP value of a feature, the higher the probability of postoperative AKI development. Each line represents a feature, and a single dot represent each value for each variable observed in the cohort. Purple represents higher feature values, and yellow represents lower feature values. (b) Variable importance of features included in the Xgboost model for prediction of AKI.
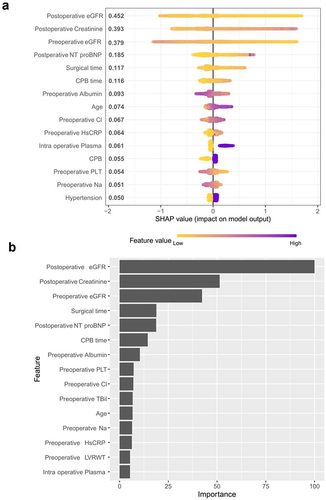
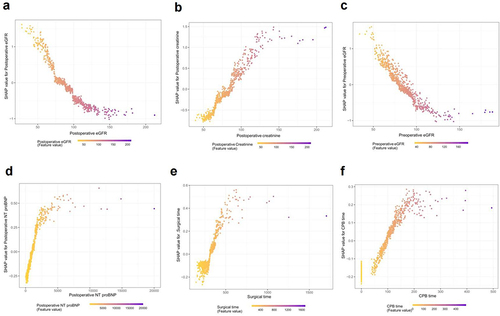
Figure 5 SHAP dependence plot of the Xgboost model. The SHAP dependence plot shows how a single feature affects the output of the Xgboost prediction model. SHAP values for specific features exceed zero, representing an increased risk of AKI development. (a) Postoperative eGFR; (b) Postoperative creatinine; (c) Preoperative eGFR; (d) Postoperative NT-proBNP; (e) Surgical time; (f) CPB time.