Figures & data
Figure 1 Absolute number of weekly admissions throughout the period. Individuals in the no vaccine group had not received any dose of any type of vaccine against COVID-19. Vertical dotted lines indicate the start/end of each COVID-19 wave in our area.
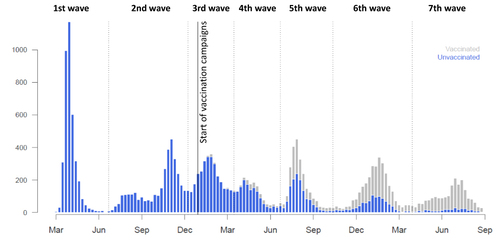
Table 1 Demographic, Clinical, and Epidemiological Characteristics of Individuals Included in the Primary Analysis
Figure 2 Distribution of Queralt DxS-based risk groups, by age and sex, among individuals who did not and did develop critical illness. Primary analysis population (N=10,551).
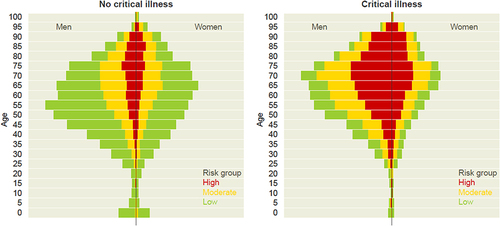
Figure 3 Effect of age and sex on critical illness using multiple logistic regressions (adjusted by wave). The baseline model included only age, sex, and hospital, whereas the other models were built by adjusting the baseline model for each of the multimorbidity measures: the Charlson index, the Elixhauser index, the unweighted count of Elixhauser diagnoses, and the Queralt DxS.
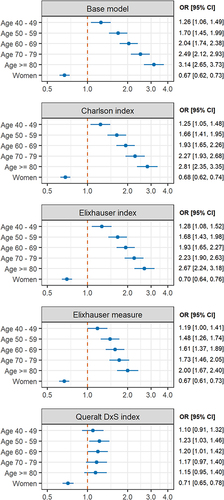
Table 2 Performance of the Models for Explaining Critical Illness. The Baseline Model Included Age, Sex, Wave, and the Hospital in Which Admission Occurred
Figure 4 Causal mediation analysis: role of comorbidity burden on the association between age and incidence of critical illness, with comorbidity burden assessed using the Charlson index, the Elixhauser index, the Elixhauser count, and the Queralt DxS index. The proportion mediated shows the contribution of the comorbidity-mediating pathway to critical illness, estimated as the proportion between the ACME and the total effect. The dotted line indicates the null value of the effect.
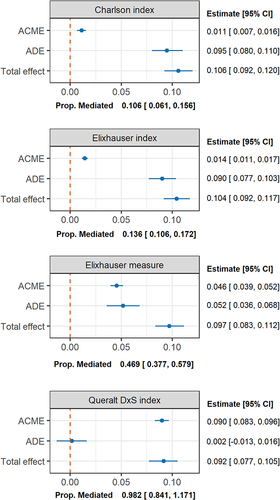
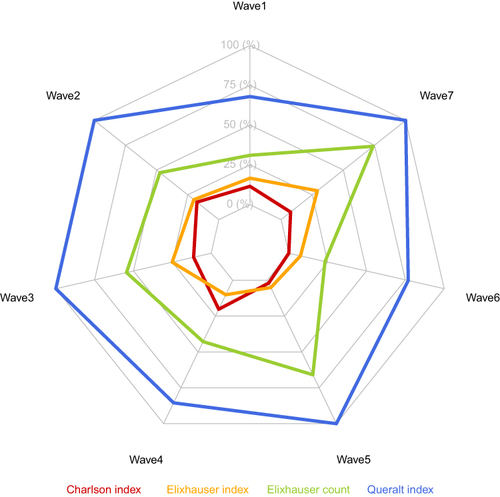
Figure 5 Proportion of mediation of comorbidity over the total effect of age on the risk of critical illness according to wave. Each color corresponds to a measure of comorbidity burden. For display purposes, the mediation proportion is limited to a 0–100 scale (values higher than 100 are set to 100 and values lower than 0 are set to 0).