Figures & data
Figure 1 Flowchart.
Abbreviations: HF, heart failure; eGFR, estimated glomerular filtration rate.
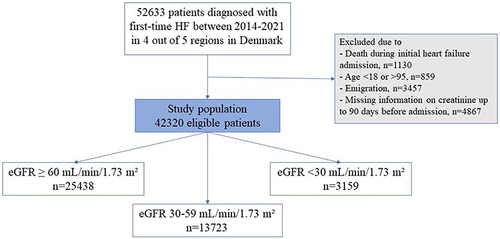
Table 1 Baseline Characteristics of the Study Population at Time of HF Diagnosis Stratified According to eGFR at Baseline
Figure 2 Six-month initiation rates of HF therapy treatment according to eGFR at baseline. (a) RAS inhibitor treatment. (b) MRA treatment. (c) BB treatment.
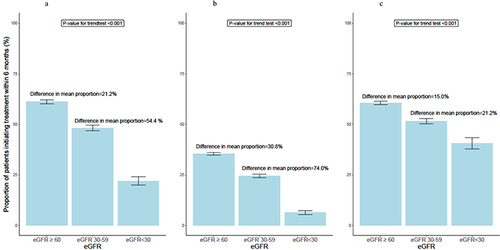
Table 2 Multivariate adjusted Hazard Ratios and 95 % Confidence Interval for HF therapy initiation
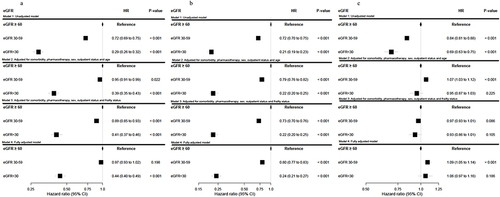
Figure 3 Cox proportional hazards models for HF therapy initiation according to eGFR at baseline. (a) RAS inhibitor treatment. (b) MRA treatment. (c) BB treatment.
Notes: Model 1: Unadjusted model. Model 2: Adjusted for sex, diagnostic setting, calendar year, concomitant comorbidity, plasma potassium, pharmacotherapy, and age. Model 3: Adjusted for sex, diagnostic setting, concomitant comorbidity, plasma potassium, pharmacotherapy, and frailty status. Model 4: Fully adjusted model, adjusted for sex, diagnostic setting, concomitant comorbidity, plasma potassium, pharmacotherapy, age, and frailty status.