Figures & data
Table 1 ARIMA Model Results Summarizing the Association of the COVID-19 Pandemic and Stringency Index with Drug Dispensing in the Netherlands
Table 2 ARIMA Model Results Summarizing the Association of the COVID-19 Pandemic and Stringency Index with New Drug Dispensing in the Netherlands
Figure 1 Monthly prevalence (left-hand plots) and incidence (right-hand plots) per 1000 people of aggregated chloroquine drug class (HCQ and CQ) and ivermectin from January 2017 to December 2021 in the Netherlands. The gray vertical dashed line is the start date of the pandemic in the Netherlands. The blue solid line represents the observed data, the red solid line represents the data fitted by the ARIMA model, while the red dotted line with confidence interval (red bands) represents the predicted trend in the absence of a pandemic.
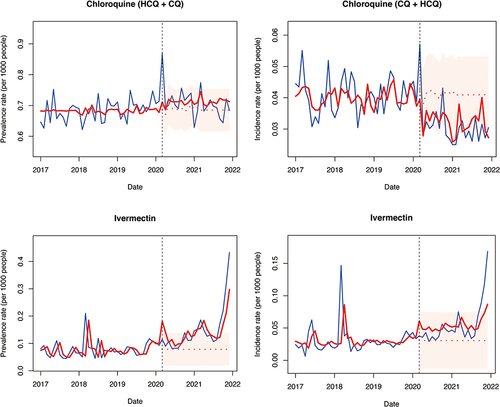
Figure 2 Monthly prevalence (left-hand plots) and incidence (right-hand plots) per 1000 people of antihypertensive and antidiabetic drugs from January 2017 to December 2021 in the Netherlands. The gray vertical dashed line is the start date of the pandemic in the Netherlands. The blue solid line represents the observed data, the red solid line represents the data fitted by the ARIMA model, while the red dotted line with confidence interval (red bands) represents the predicted trend in the absence of a pandemic.
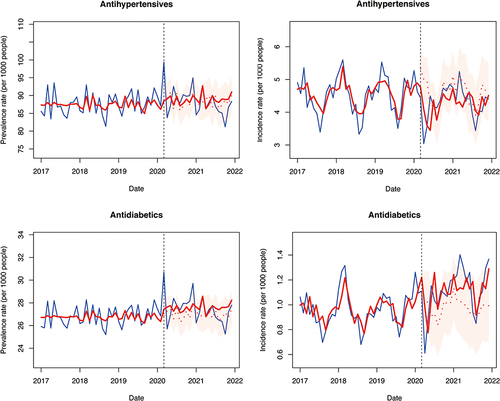
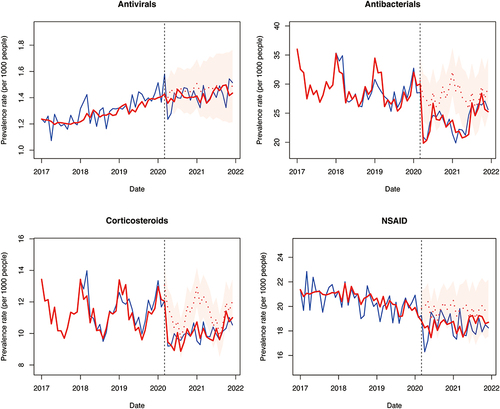
Figure 3 Monthly prevalence per 1000 people of antiviral, antibacterial, corticosteroids for systemic use, and NSAID from January 2017 to December 2021 in the Netherlands. The gray vertical dashed line is the start date of the pandemic in the Netherlands. The blue solid line represents the observed data, the red solid line represents the data fitted by the ARIMA model, while the red dotted line with confidence interval (red bands) represents the predicted trend in the absence of a pandemic.