Figures & data
Figure 1 Flow chart for patients registered in the ASR and DCR in the period 1979–2008, with number of patients (N), reasons for exclusion, and distribution across registries. Includes patients only registered in the ASR (ASR/DCR), patients only registered in the DCR (DCR/ASR), and patients registered in both registries (ASR∩DCR).
Abbreviations: ASR, Aarhus Sarcoma Registry; DCR, Danish Cancer Registry; WHO, World Health Organization.
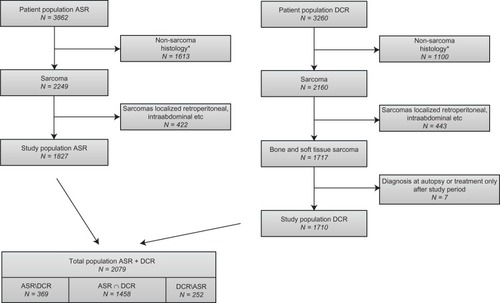
Table 1 Completeness and correctness of data by selected variables in the Aarhus Sarcoma Registry
Table 2 Completeness of patient registration in the Aarhus Sarcoma Registry by gender, age, region, and time period
Figure 2 Crude IR per 100,000 inhabitants and World Health Organization age-standardized IRR, with 95% CI and P values, for bone and soft tissue sarcoma in the Aarhus Sarcoma Registry from 1979 to 2008 according to age (years) and gender (n = 1827).
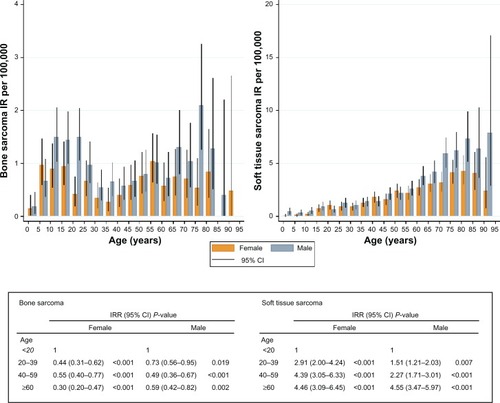
Figure 3 World Health Organization age-standardized IR per 100,000 inhabitants and IRR, with 95% CI and P values for overall, bone, and soft tissue sarcoma in the Aarhus Sarcoma Registry from 1979 to 2008 (n = 1827).
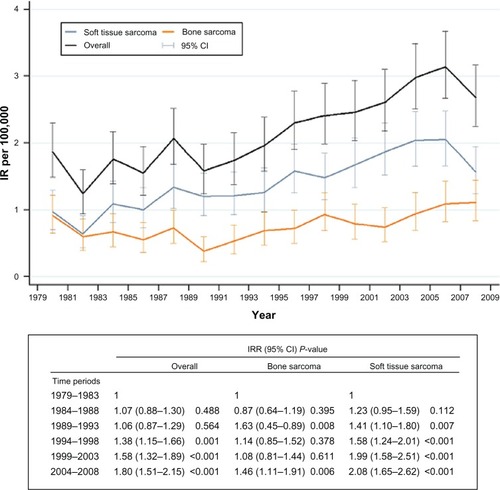
Table 3 Age-specific and gender-specific incidence rates per 100,000 inhabitants per year by time period
Appendix A Histology subtypes, based on ICD-O-3 World Health Organization codes, excluded from both the Aarhus Sarcoma Registry and the Danish Cancer Registry in this study
Appendix B Topography in the Aarhus Sarcoma Registry and the Danish Cancer Registry excluded from the study