Figures & data
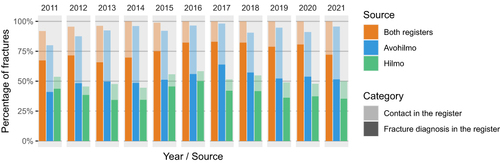
Figure 1 Flowchart for establishing the gold standard of wrist fractures for the participants of the OSTPRE study cohort from 2011 to 2021. The Venn diagram in the bottom box illustrates the overlap between different sources of fracture events in the gold standard.
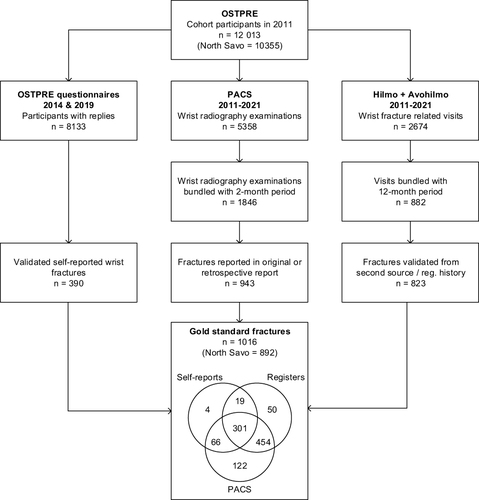
Table 1 Coverage and False Discovery Rates for Different Data Sources and Algorithms
Figure 2 The yearly register coverage of gold standard fractures. Since 2014, almost all the fractures have some contact in Hilmo or Avohilmo within 14 days from the index date but the recording rate for diagnostic codes is incomplete.