Figures & data
Figure 1 Study design with exposure and baseline periods.
Notes: Days 14–0 shown in orange were excluded from analysis and the time intervals shown in green are the strata of the exposed period used in analysis.
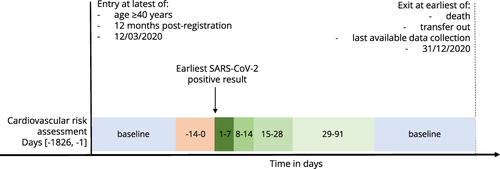
Table 1 Baseline Characteristics of Study Population
Figure 2 Study population flow chart.
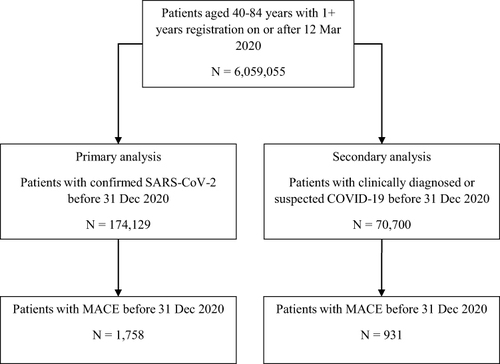
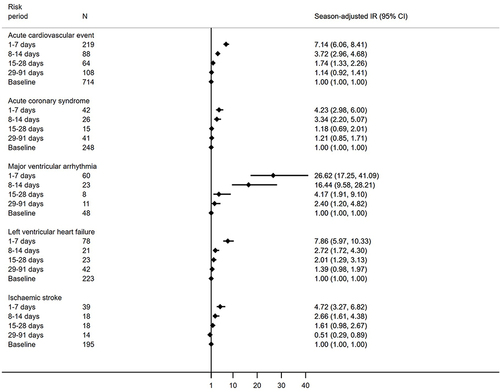
Table 2 Season-Adjusted Incidence Ratios for Acute Cardiovascular Events Occurring in Exposed Periods After SARS-CoV-2 Infection by Cardiovascular Risk and COVID-19 Wave
Figure 3 Incidence ratios for first acute cardiovascular events in risk periods following SARS-CoV-2 by cardiovascular event type.