Figures & data
Figure 1 Flow diagram of the study population.
Abbreviations: NHIS, National Health Insurance Service; SSc, systemic sclerosis.
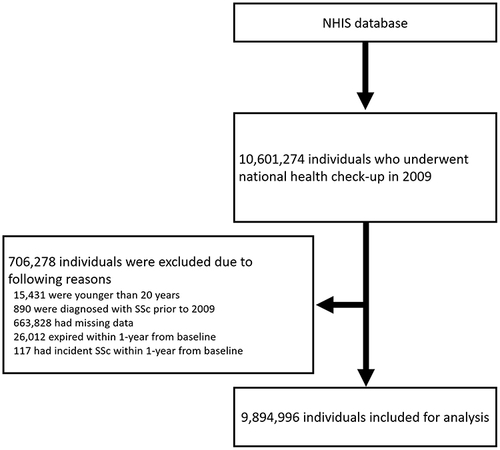
Table 1 Comparison of Baseline Characteristics According to the Development of Systemic Sclerosis During Follow Up Stratified by Sex
Table 2 Incidence of Systemic Sclerosis According to Lipid Profile in Continuous Variable
Figure 2 Cumulative incidence of SSc over time.
Abbreviation: SSc, systemic sclerosis.
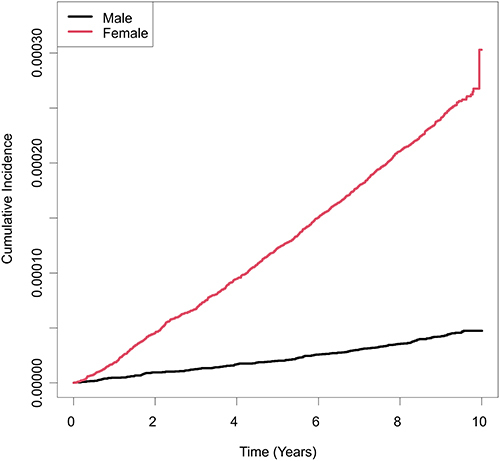
Figure 3 Spline curves showing the relationship between (A) TC, (B) HDL-C, (C) LDL-C, (D) triglyceride and risk of incident SSc.
Abbreviations: TC, total cholesterol; HDL-C, high-density lipoprotein cholesterol; LDL-C, low-density lipoprotein cholesterol; HR, hazard ratio; CI, confidence interval; SSc, systemic sclerosis.
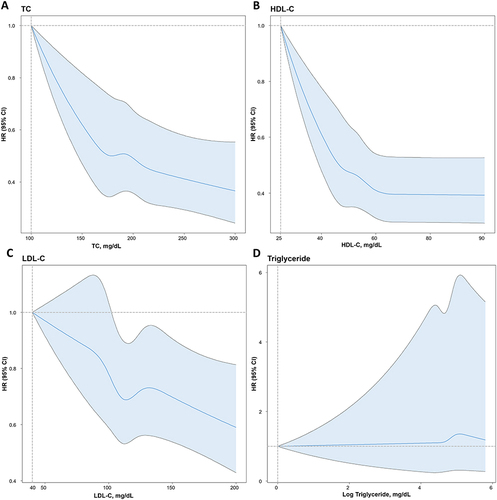
Table 3 Subgroup Analysis of the Association Between Levels of HDL-C and Incidence of Systemic Sclerosis
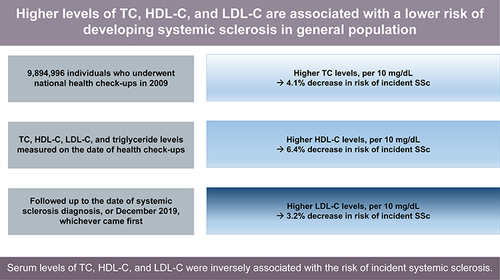
Figure 4 Summary of the present study.
Abbreviations: TC, total cholesterol; HDL-C, high-density lipoprotein cholesterol; LDL-C, low-density lipoprotein cholesterol; HR, hazard ratio; CI, confidence interval.