Figures & data
Figure 1 Principles of causal diagrams.
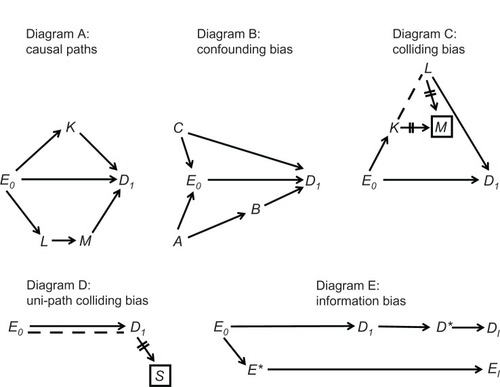
Figure 2 A causal diagram for a prospective cohort study (confounders omitted).
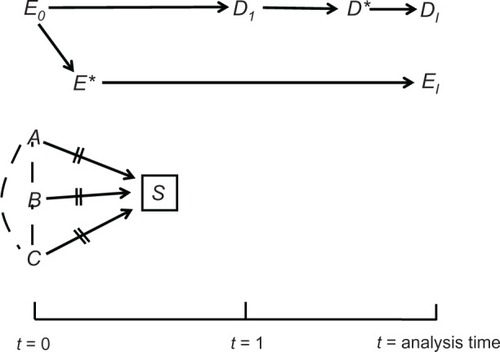
Figure 3 Several structures of sampling colliding bias in a cohort study.
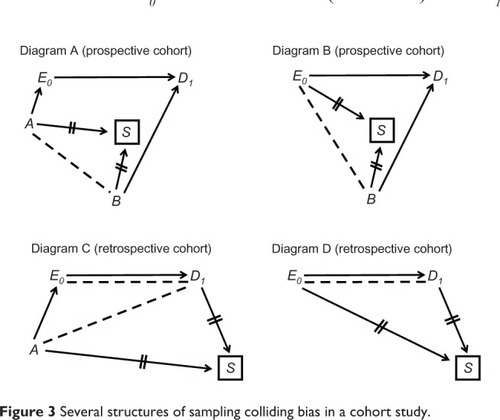
Figure 4 A causal diagram for a cross-sectional study (confounders omitted).
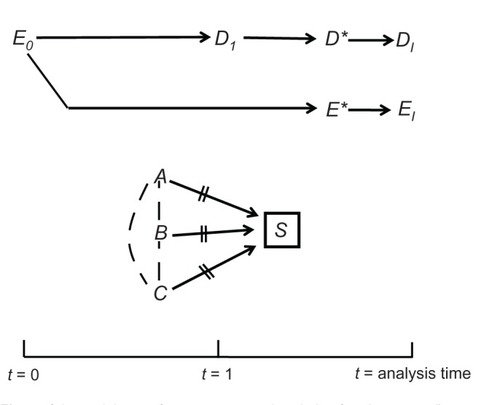
Figure 5 Several structures of sampling colliding bias in a cross-sectional study.
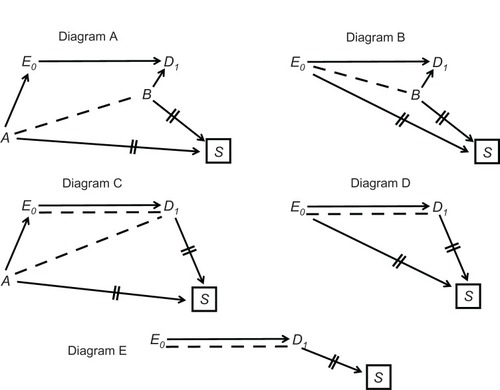
Figure 6 The tradeoff between information bias and variance in estimating the probability ratio for two effects: E0 → D1; E0 → D2.
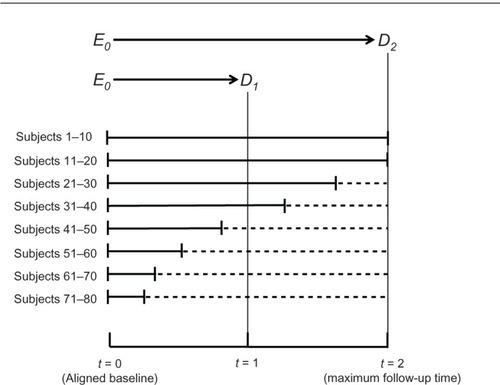
Figure 7 Estimating the effect E0 → D1 by a cohort study (calendar-based graph).
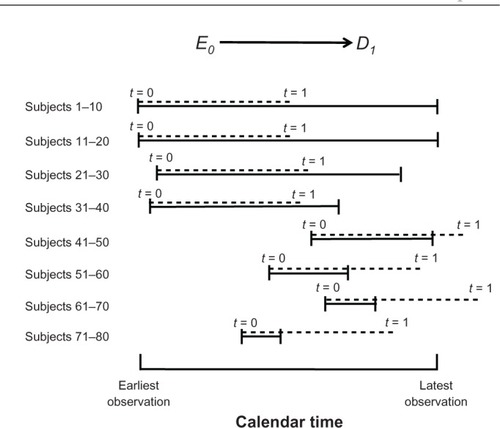
Figure 8 Estimating the effect E0 → D1, by a cross-sectional study (calendar-based graph).
