Figures & data
Figure 1 PRISMA flowchart. *Five studies provided data and were included in more than one review. Adapted from Page MJ, McKenzie JE, Bossuyt PM, et al. The PRISMA 2020 statement: an updated guideline for reporting systematic reviews. BMJ. 2021;372:n71. Creative Commons.
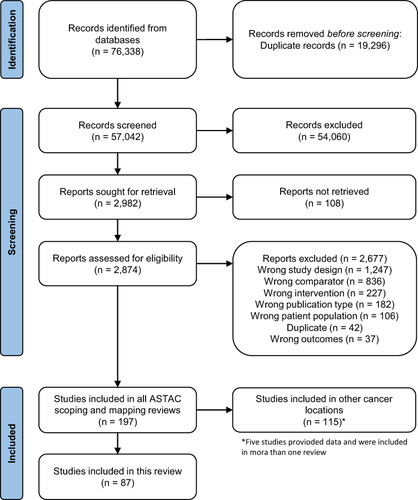
Table 1 Characteristics of the Included Studies Providing Data for Advanced Liver Cancer
Figure 2 Evidence map for ACD in advanced liver cancer. The size of each dot represents the number of studies that address the intervention/outcome relationship. The color of each dot represents the methodological design of the study group.
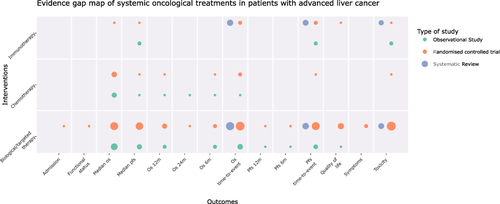
Figure 3 Summary of the direction of the effect for each study and outcome in patients with advanced liver cancer.
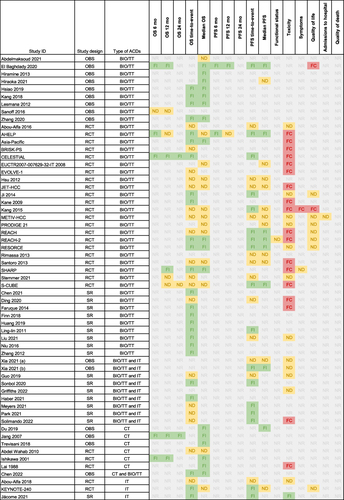
Table 2 Characteristics of the Included Studies on Advanced Gallbladder and Bile Duct Cancers
Figure 4 Evidence map for ACD in advanced gallbladder/bile duct cancers. The size of each dot represents the number of studies that address the intervention/outcome relationship. The color of each dot represents the methodological design of the study group.
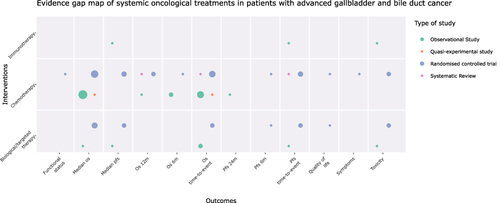
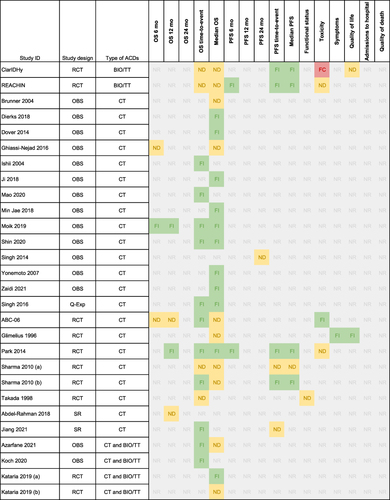
Figure 5 Summary of the direction of the effect for each study and outcome in patients with advanced gallbladder and bile duct cancers.